1. Introduction
Wind turbines, classified into two main types, horizontal-axis and vertical-axis turbines, convert the wind’s kinetic energy into electrical power. Vertical-axis wind turbines (
VAWTs) generally exhibit lower efficiency than horizontal-axis wind turbines (
HAWTs). The primary reason for this difference in efficiency is that the sliding surface of
VAWTs provides an effective driving force for only slightly more than half of its total area. During the rotational cycle, the varying angle of attack for
VAWTs results in flow detachment, dynamic stalling, and unequal force distribution on both sides of the rotor. Consequently, aerodynamic performance becomes unstable, resulting in oscillation and noise [
1,
2,
3]. On the other hand,
VAWTs possess inherent advantages over
HAWTs, such as user-friendliness, lower cost, simpler design, and no need for a yaw system. Savonius rotors belong to a category of vertical-axis wind turbines. The driving torque is generated when the wind’s drag on the blades combines with the cup-shaped blades, which provide a large surface area for the wind to exert pressure on. Savonius turbines rely on drag force, which is more significant than lift force at low speeds. Due to this, the cup shape partially retains air as the blade rotates, enabling the turbine to operate more efficiently. Furthermore, Savonius turbines are particularly beneficial in remote areas due to their lower initial investment, ongoing costs, and reduced maintenance requirements. Unlike large-scale wind turbines, Savonius rotors have fewer location constraints, making them more versatile for various installation sites [
4,
5,
6]. The Savonius wind rotor features two semi-cylindrical shaped cylinders. In principle, the pressure disparity between the two turbine blades generates rotational motion. The Savonius rotor presents various benefits, such as a substantial self-starting torque and the capacity to function independently of the wind’s direction. However, compared to other wind turbine types, their efficiency is generally lower.
Several review articles [
7,
8,
9,
10] provide comprehensive discussions on experimental and numerical research outcomes for wind turbines. The impact of geometric factors on the aerodynamic performance of turbines has captured the attention of many researchers. By modifying parameters such as aspect ratio (
AR), overlap ratio (
OR), twist angle (
TA), and blade number (
BN), significant performance improvements have been observed in numerous studies. Moreover, significant discoveries have been made in Savonius’s wind turbine design [
11]. The efficiency of Savonius wind turbines can be enhanced by incorporating an overlap area between the blades, which allows the wind to circulate back into the returning blade and generate positive torque [
12]. The effectiveness of this approach has been demonstrated by comparing the power generation of turbines with and without the overlap section [
13]. Ebrahimpour et al. [
14] found that optimal performance for a turbine could be achieved with an
OR between 0.10 and 0.15, which is consistent with experimental results. This conclusion was drawn by comparing the performance of blades with equal overlaps along the X and Y axes. Furthermore, numerical simulations [
15] have indicated that the elliptical profile significantly improves performance at an
OR value of 0.15. In their research, R. Hassanzadeh and M. Mohammadnejdd investigated various overlap ratios, including 0.1, 0.02, and 0.3. They discovered that the optimal power coefficient value occurs at an inward overlap ratio of 0.2. The optimal power coefficient value also changes as the overlap ratio varies in either direction [
16]. Researchers analysed the rotor blades’ pressure distribution to comprehend better the critical low-pressure and high-pressure areas that contribute to the overall torque output of Savonius turbines [
17]. Experimental findings indicate that adjusting the geometry of blades in a Savonius rotor wind turbine can lead to an enhanced power coefficient. These results highlight the possibility of optimizing the turbine’s performance by strategically modifying blade geometry [
18,
19]. An alternative optimization approach is the design of experiments (
DOE), which primarily aims to select specific design parameters that effectively represent the design space. Given the relatively small number of control points, employing a factorial method is an appropriate strategy [
20]. By using
DOE, researchers can systematically explore the relationships between design factors and outcomes, enabling a more comprehensive understanding of the design space and facilitating the identification of optimal solutions [
21]. Blades with a regular zigzag pattern on their inner surfaces were tested in an open wind tunnel. A 2D Mode simulation at an overlap ratio of 0.2 yielded the highest power coefficient, which was 3.04% higher than at a 0.15 overlap ratio and 5.54% higher than at a 0.1 overlap ratio [
22]. However, the number of blades is another important geometric factor influencing wind turbine performance [
23,
24,
25]. Researchers compared a two-blade Savonius wind turbine and a three-blade Savonius wind turbine with identical blade types to demonstrate this effect [
26].
This research conducts an in-depth numerical analysis of novel blade geometry and guide gap flow, focusing on turbulence effects that influence Savonius wind turbine performance. By understanding and incorporating these effects into rotor blade profile design, improvements in aerodynamic performance and efficiency are achieved. Computational simulations are fine-tuned using a statistical method and full factorial experimental design (FFD) for evaluating parameters, including the power coefficient (Cp) assessment. To confirm the accuracy of the numerical outcomes, they are compared with the most recent experimental data, which ultimately helps enhance the efficiency of Savonius wind energy conversion systems.
2. Specification of the Numerical Modeling
A comprehensive simulation study using computational fluid dynamics (
CFD) software was conducted on a Savonius wind turbine with elliptical blades. The aim was to evaluate the impact of various blade profiles on the total efficiency of the turbine rotor. This in-depth investigation helped to identify the optimal blade profile for improved efficiency and power output. Simulation analysis was conducted on a Savonius wind turbine with elliptical blades to evaluate how blade profiles affect turbine rotor performance. The geometric parameters employed in the computational analysis, including a height-to-diameter ratio (
H/D) of 1, an ellipticity (
e) of D/5 (equivalent to
d/3, or 0.2), and a blade number (
BLN) of 2, were based on the scaled reference model from previous research [
27].
Utilizing this scaled reference model enables the recognition of advancements and a more thorough understanding of the effects of various design selections on the turbine’s total performance.
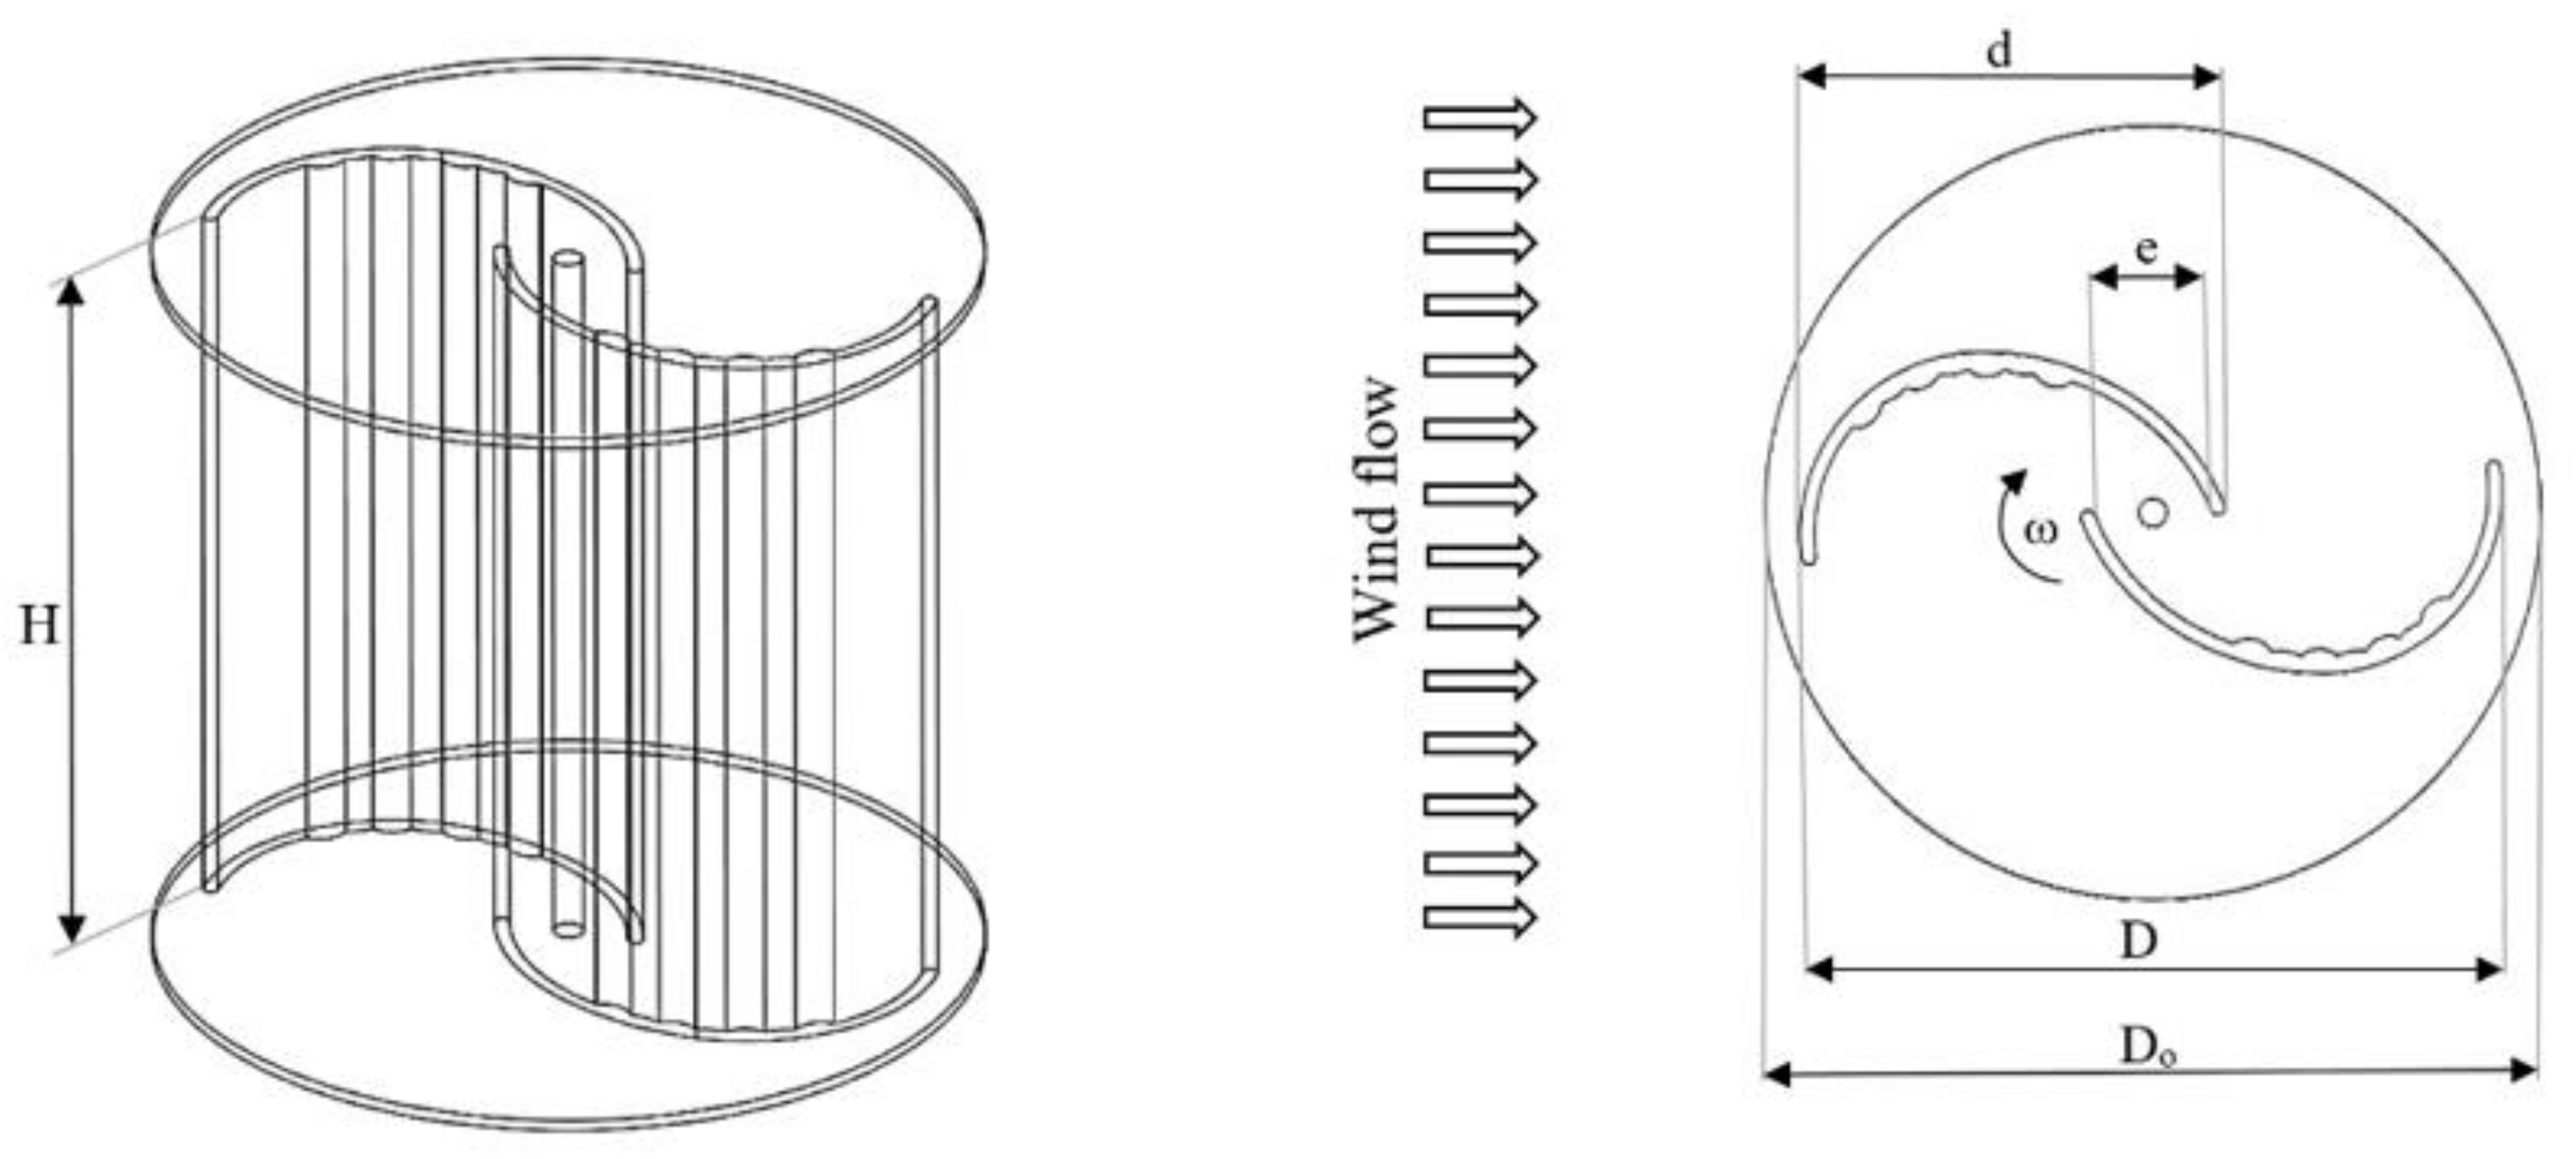
Figure 1 illustrates the fundamental aspects of the utilized geometry, including its dimensions and features. Additionally, the reference model is a benchmark for validating computational and experimental results, ensuring that the study’s findings are consistent with existing research.
Initially, the aspect ratio (
AR) was identified as the difference between the turbine’s height (
H) and diameter (
D), as depicted in Equation (1). Furthermore, elements (
e) and (
d) were linked using the overlap ratio (
OR) operator, as demonstrated in Equation (2). Additionally, the turbine rotor’s frontal swept area (
A) was utilized to assess the model’s performance, as outlined in Equation (3).
Figure 1 illustrates the standard Savonius model rotor, employed as the reference model (
RM), with parameter definitions including a top (
Do) of 165 mm and a maximum (
H) of 150 mm. Consequently, the rotor’s (
D) was equal to 150 mm. The rotor blade thickness was 3 mm, assuming an (
AR) of 1 (
H/D), an (
OR) of 0.2, and a total of 2 blades on the rotor. The blade thickness of 3 mm was selected based on previous studies and practical considerations for manufacturing and structural stability.
3. Numerical Method
In this study, the computational domain geometry was created in two phases using SolidWorks and
ANSYS CFX software, as illustrated in
Figure 2, showcasing the 3D computation scope. The complexity and time requirements of 3D simulations can be challenging due to their demand for substantial computational resources. Overcoming these challenges may involve investing in more powerful computational resources or employing more efficient simulation techniques that reduce computational time without compromising the accuracy of the results. A series of transient Computational Fluid Dynamics (
CFD) simulations were conducted to assess the performance of the rotor for each simulation case. The Reynolds-Averaged Navier–Stokes (
RANS) equations were solved using
ANSYS CFX 2020R1 software, employing a second-order-accurate finite-volume discretization scheme.
The governing equations for this study are based on the Reynolds-Averaged Navier–Stokes (
RANS) equations, which include the continuity equation and the momentum equation as displayed below [
28]:
In these equations, ρ represents the fluid density, vi corresponds to the velocity components, p signifies the total pressure, Fi denotes the external body force components, and μ is the dynamic viscosity. The velocity vi can be expressed as the sum of the time-averaged value ύ and the fluctuating component vi’.
The Shear Stress Transport (
SST)
k-ω turbulence model is chosen to model the turbulence terms of the
RANS equations [
29]. The turbulent kinetic energy (
k) and specific dissipation rate (
ω) are computed using the following equations:
In these equations, Gk and Gω represent the generation of k and ω due to turbulent mean-velocity gradients, respectively; Γk and Γω denote the effective diffusivity; Yk and Yω indicate the dissipation of k and ω due to turbulence; Dω refers to the cross-diffusion term; and Sk and Sω are user-defined source terms.
The wind tunnel test dimensions were employed to define the computational domain, which included wind flow and rotor rotation domains (test section). The stationary domain was characterized by velocity intake, exit pressure, and a no-slip wall. The rotor domain was 1.1 times the rotor diameter (D), with a 150 mm diameter. The frozen rotor model was essential in establishing a connection between the rotor and stationary domains, enabling the seamless integration of these two distinct regions in the simulation process. This model facilitated the accurate representation of the interaction between the moving rotor and the stationary components. However, during the simulations, the rotor domain rotated at a wind speed of 9 m/s, and an unsteady effect analysis was performed for all cases. The simulation utilized 40-time steps per rotor rotation and six processing cores, taking five hours to complete. A transient rotor-stator (TRS 360) interface model was also developed for 3D viscous flutter research. During the simulation, one to three internal iterations were necessary for each time step. Precise root mean square (RMS) outcomes could be achieved by ensuring the rotor completed four rotations.
This study employs an unstructured mesh topology to demonstrate its flexibility and effectiveness in generating a high-quality mesh for rotating and fixed domains. Unstructured meshes offer a meshing approach that does not rely on predefined patterns or shapes, allowing for efficient mesh generation in complex geometries. As shown in
Table 1, a grid independence investigation was conducted to evaluate mesh quality regarding skewness and orthogonality. This analysis ensures that the mesh is refined to an appropriate degree, leading to accurate and reliable results while maintaining computational efficiency. The unstructured mesh approach provides a robust and adaptable solution for handling diverse and intricate geometries, making it a valuable tool for computational fluid dynamics simulations in the context of wind turbine blade design and analysis.
In this study, the power coefficient (
Cp), a critical parameter for assessing wind turbine performance, was determined using a comprehensive meshing approach. This method produced 4,056,000 elements for both rotating and stationary domains, as detailed in
Table 2. A tetrahedral technique was utilized to inflate and refine the mesh surrounding the rotor wall, as depicted in
Figure 3. The test simulation commenced with a maximum of five inflation layers at a 1.1 growth rate, according to
Table 2. To guarantee a y+ < 5 in all operational conditions, the initial layer thickness perpendicular to the wall was established at 0.000122 m.
To further justify the chosen mesh size and type, grid independence statistics were evaluated on DOE models where the same meshing method applied to all the models in the study was adopted, ensuring consistent and accurate results. This approach demonstrates the study’s commitment to maintaining the reliability and accuracy of the computational outcomes, providing confidence in the findings obtained from the DOE models. The computational results and verifying were appropriate and robust.
To confirm the accuracy of the simulation results, they were compared to the experimental data gathered at a wind speed of 9 m/s. The
Cp values derived from the simulation findings were evaluated against the experimental data for the reference model. The results showed a maximum relative error of 8% for TSRs between 0.2 and 1.8 with an overlap ratio of 0.2 as shown in
Figure 4. A minor discrepancy between the model and experimental data was observed at higher tip speed ratios, with the simulation slightly overestimating the values. In contrast, the experimental data tended to underestimate the values at lower TSRs. A more comprehensive understanding of its importance in assessing wind turbine performance is achieved by addressing the significance of
Cp early in the research.
In transient simulations, the best convergence was achieved when variables approached the specified reference values, with twenty iterations per time step [
30]. All simulations utilized absolute convergence for continuity, velocity components, and turbulence, adhering to
CFX’s residual targets of 10
−4.
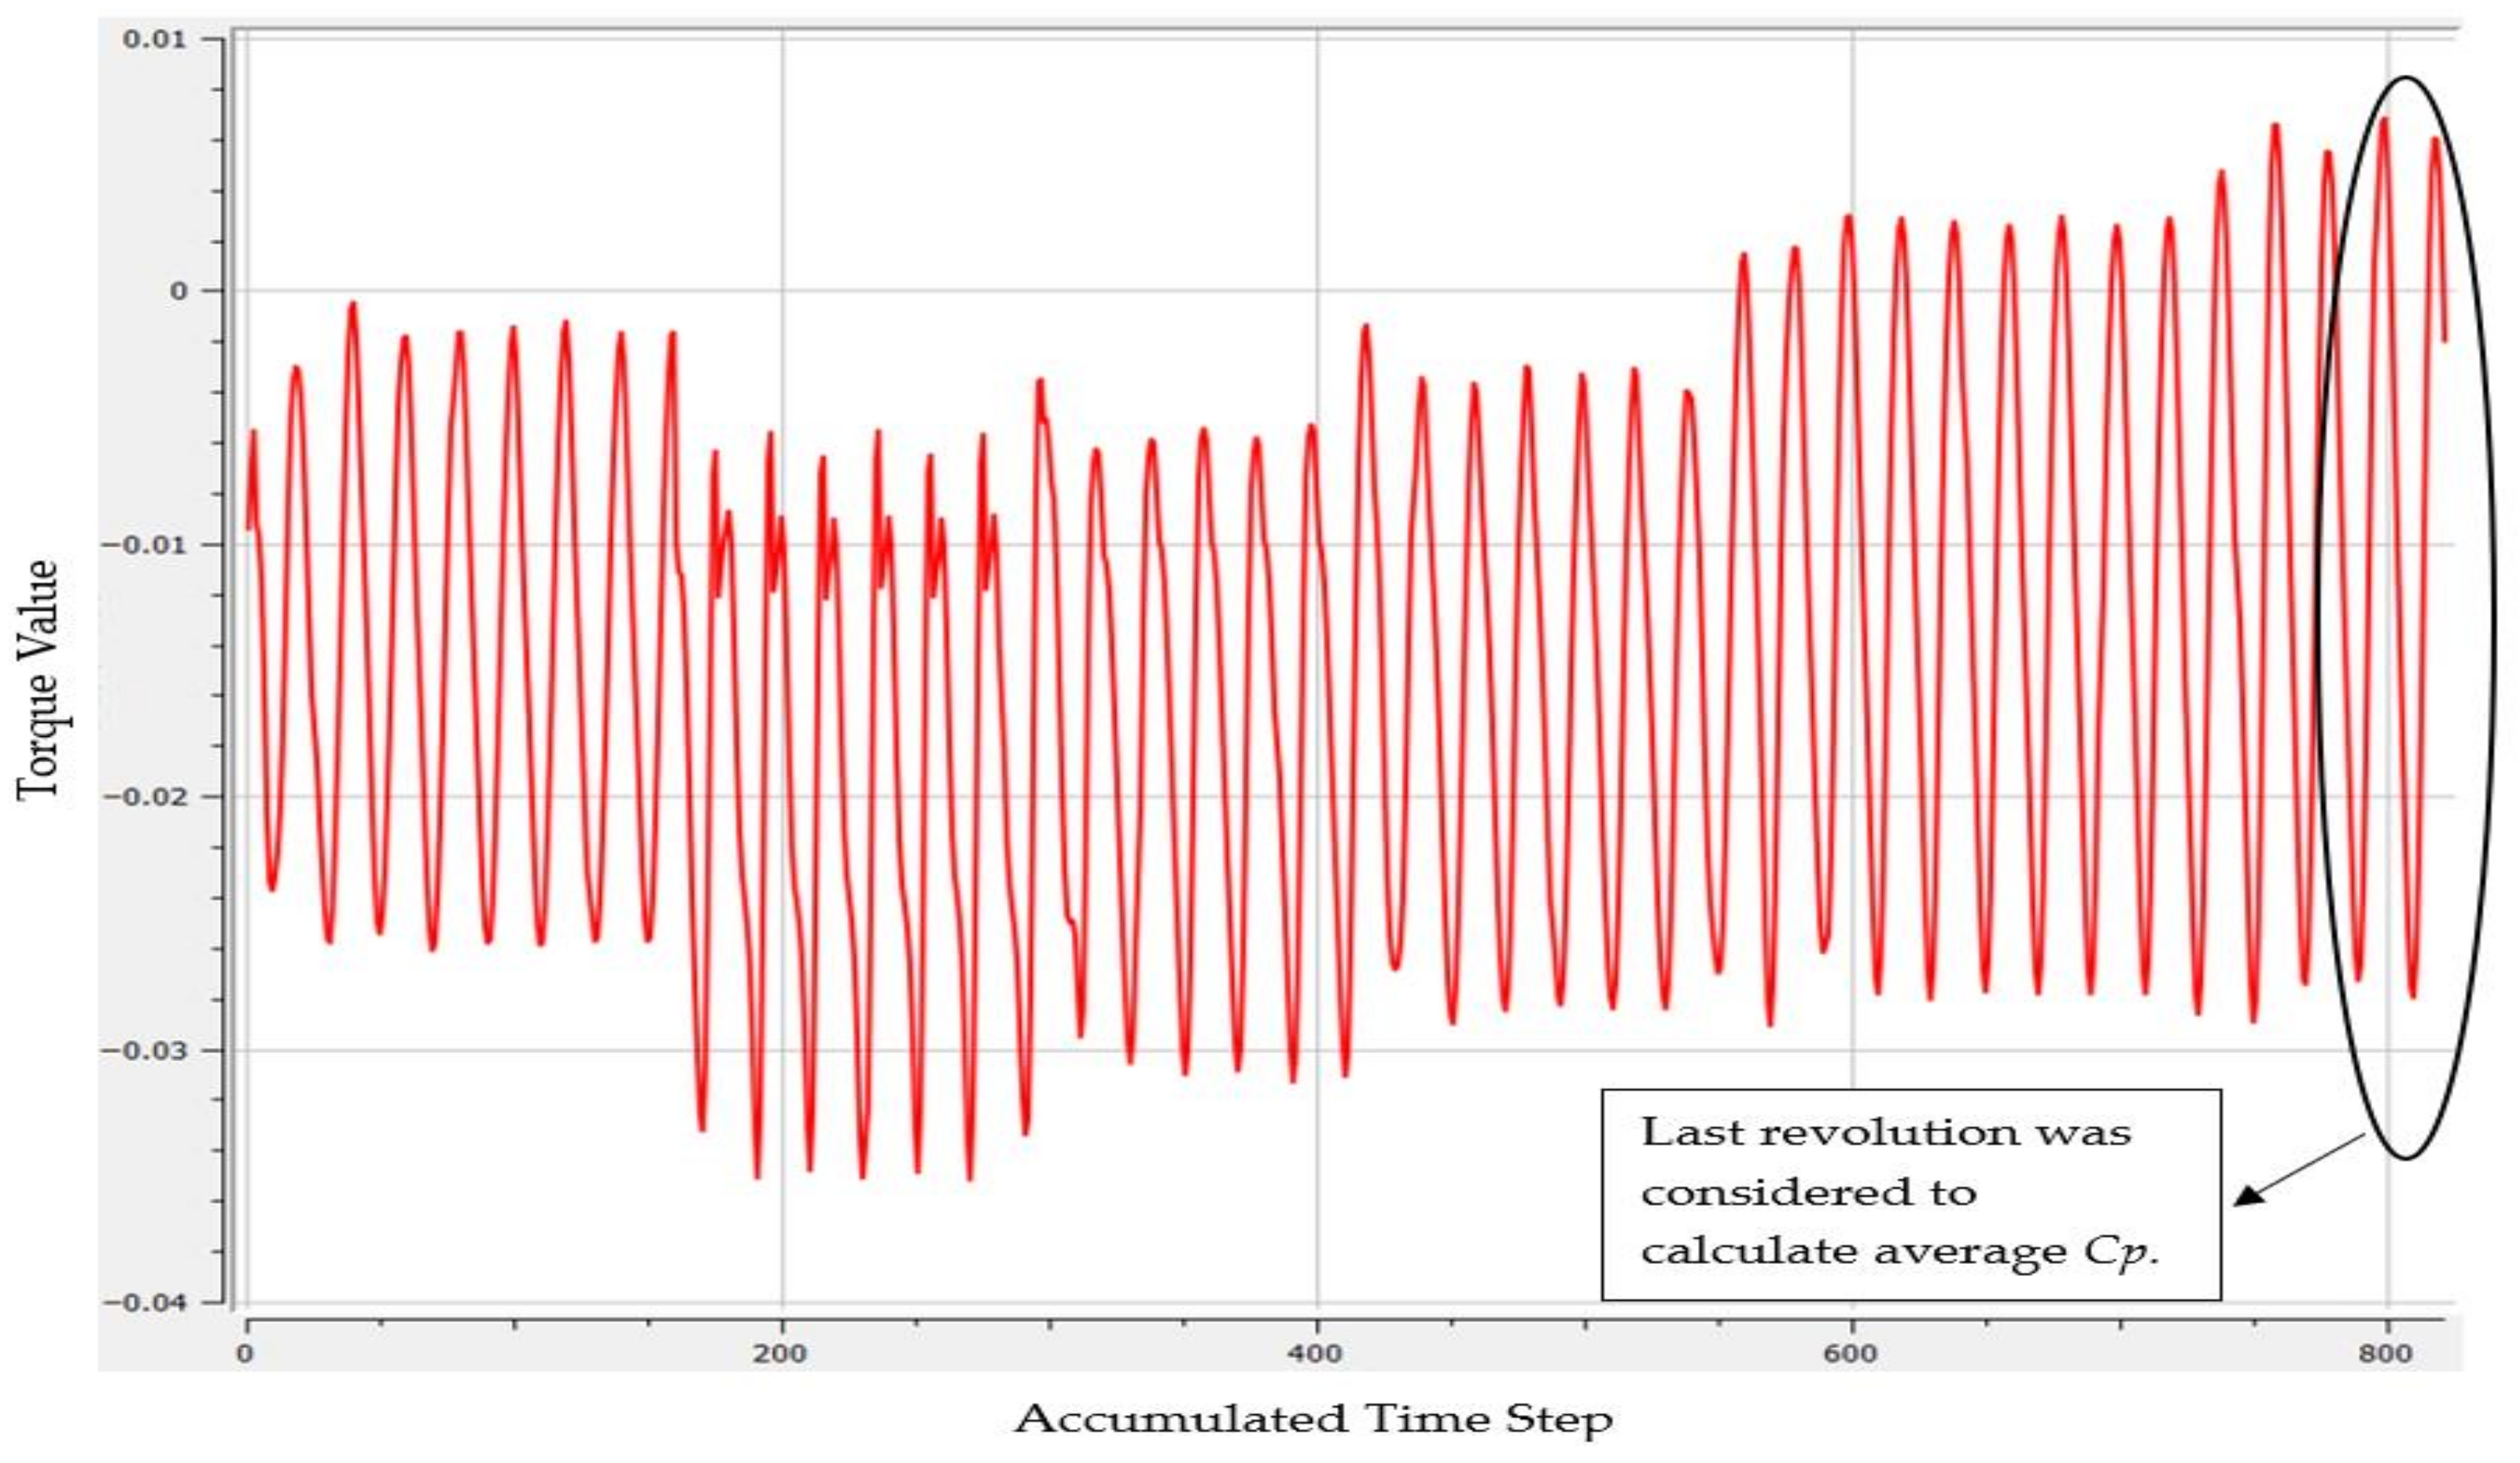
Figure 5 illustrates the instantaneous torque variation of a Savonius turbine against incremental time steps at
TSR values ranging from 0.2 to 1.8. The highest
Cp was observed at
TSR = 1. Convergence was achieved after two turbine revolutions, with four rotations in total.
Researchers conducted numerical simulations to assess each angular position’s rotor axis torque coefficient (CT). The periodicity was stabilized by averaging the last two complete rotations after a total of four turbine revolutions. Using this average CT value, Cp was estimated for all geometries with the help of Equation (3). By accurately analyzing the Cp and CT values, this comprehensive approach represents the turbine’s performance under various conditions, thereby contributing to a more in-depth understanding of the underlying factors and their impact on wind turbine efficiency.
The power coefficient (
Cp) and tip speed ratio (
TSR) express wind energy efficiency.
Cp represents the maximum efficiency of a wind turbine to transform air’s kinetic energy into rotational energy. Concurrently,
TSR denotes the rotor blade’s tip speed in proportion to the free-stream wind speed. The power generated by the rotor was calculated by multiplying its torque (
T) by its rotational velocity (
ω). These equations are crucial for assessing wind turbine performance under various conditions [
31]. Another method of characterizing the wind’s influence on a rotor involves the torque coefficient (
), which is the ratio of the rotor’s actual torque (
) to the theoretical torque (
T) [
32]:
where
is air density (mass per unit volume) at the location of the wind turbine, which at 30 degrees Celsius is 1.165 kg/m
3, T is the torque in Newton-meters generated by the rotor, influenced by the wind acting on the turbine blades,
is the theoretical torque,
is the swept area of the turbine rotor, which is the area covered by the rotation of the blades,
is the effective radius of the turbine in meters,
is the free-stream wind velocity (wind speed) upstream of the turbine, and ω is the angular velocity (rotational speed) of the rotor in radians per second. The torque produced in the experiment was calculated as follow in according to [
33].
where
and
are the pulley’s load and radius, respectively.
represents the side tight tension in kilograms,
the side slack in kilograms,
the pulley radius in meters, and
the nylon string diameter in millimeters (m).
6. Results and Discussion
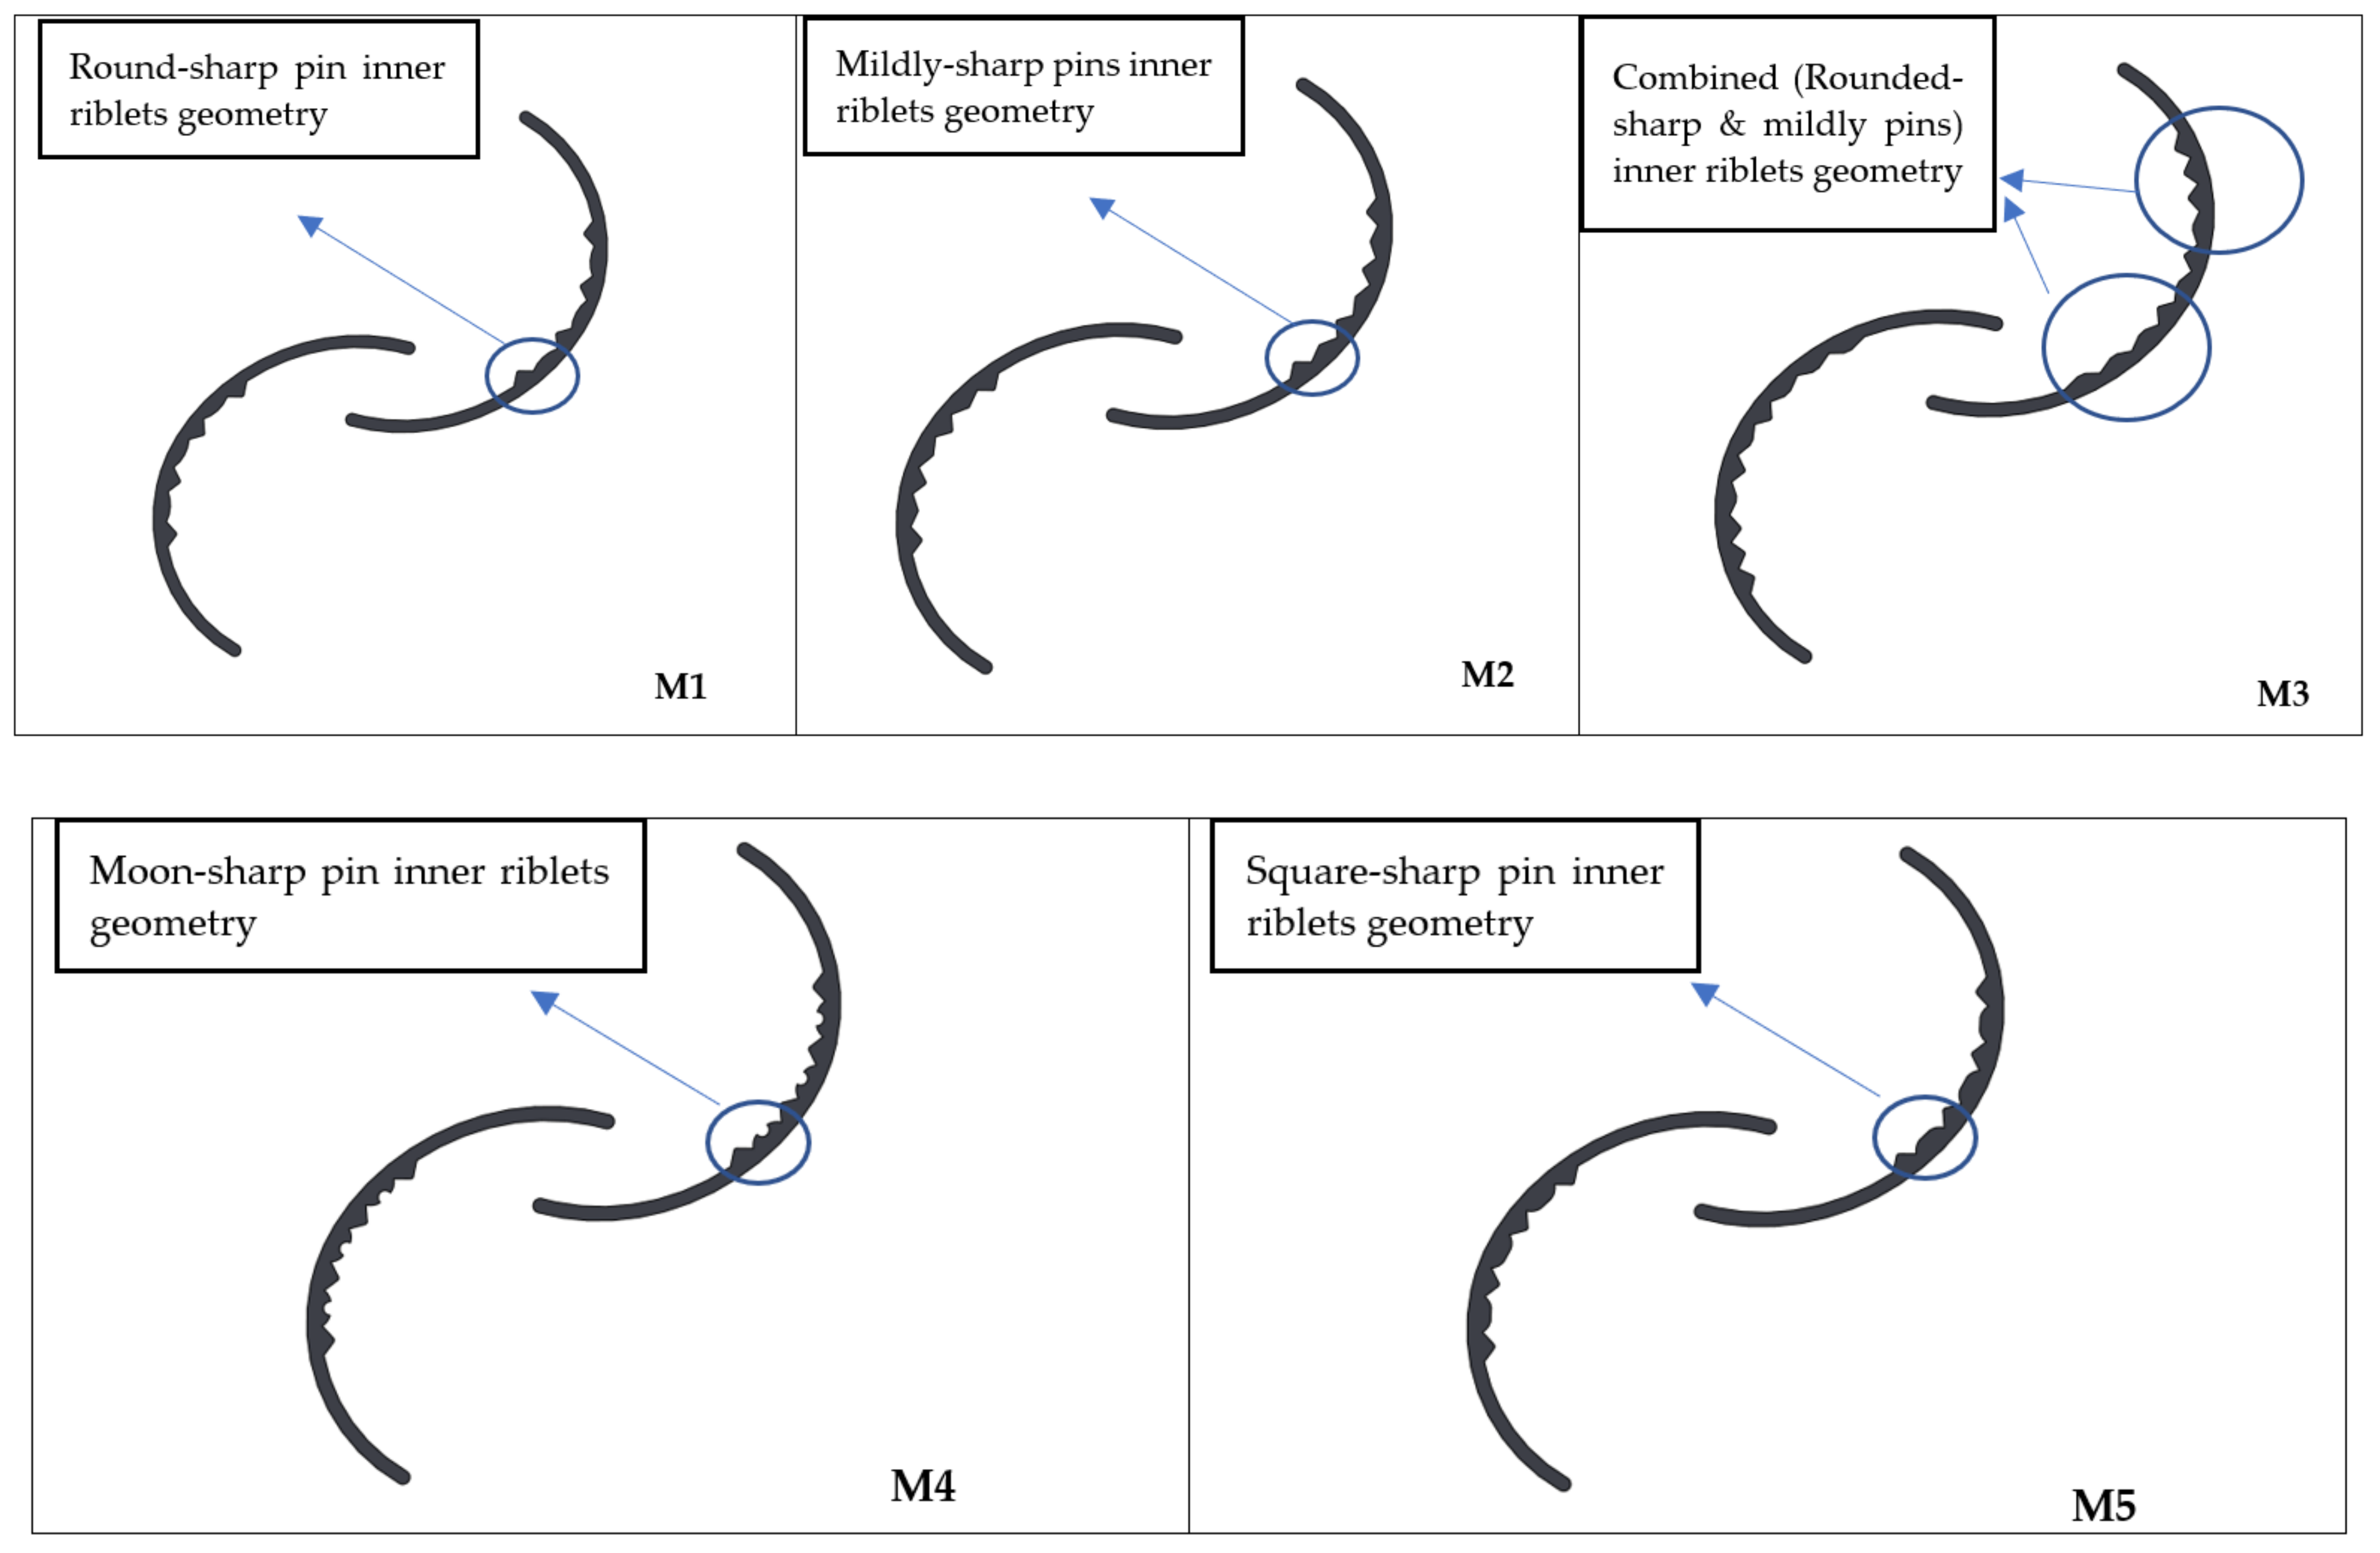
6.1. Determination of the Optimum Blade Shape Inner Profile
Using
ANSYS CFX, the modified rotor inner profiles were modelled to evaluate the actual turbine performance better. The optimization process focuses on the highest achievable
Cp at a
TSR of 1 to simplify the analysis. This approach enables researchers to concentrate on the immediate effects of varying blade profiles on turbine performance, thereby facilitating the identification of the most effective profile for the specified
TSR.
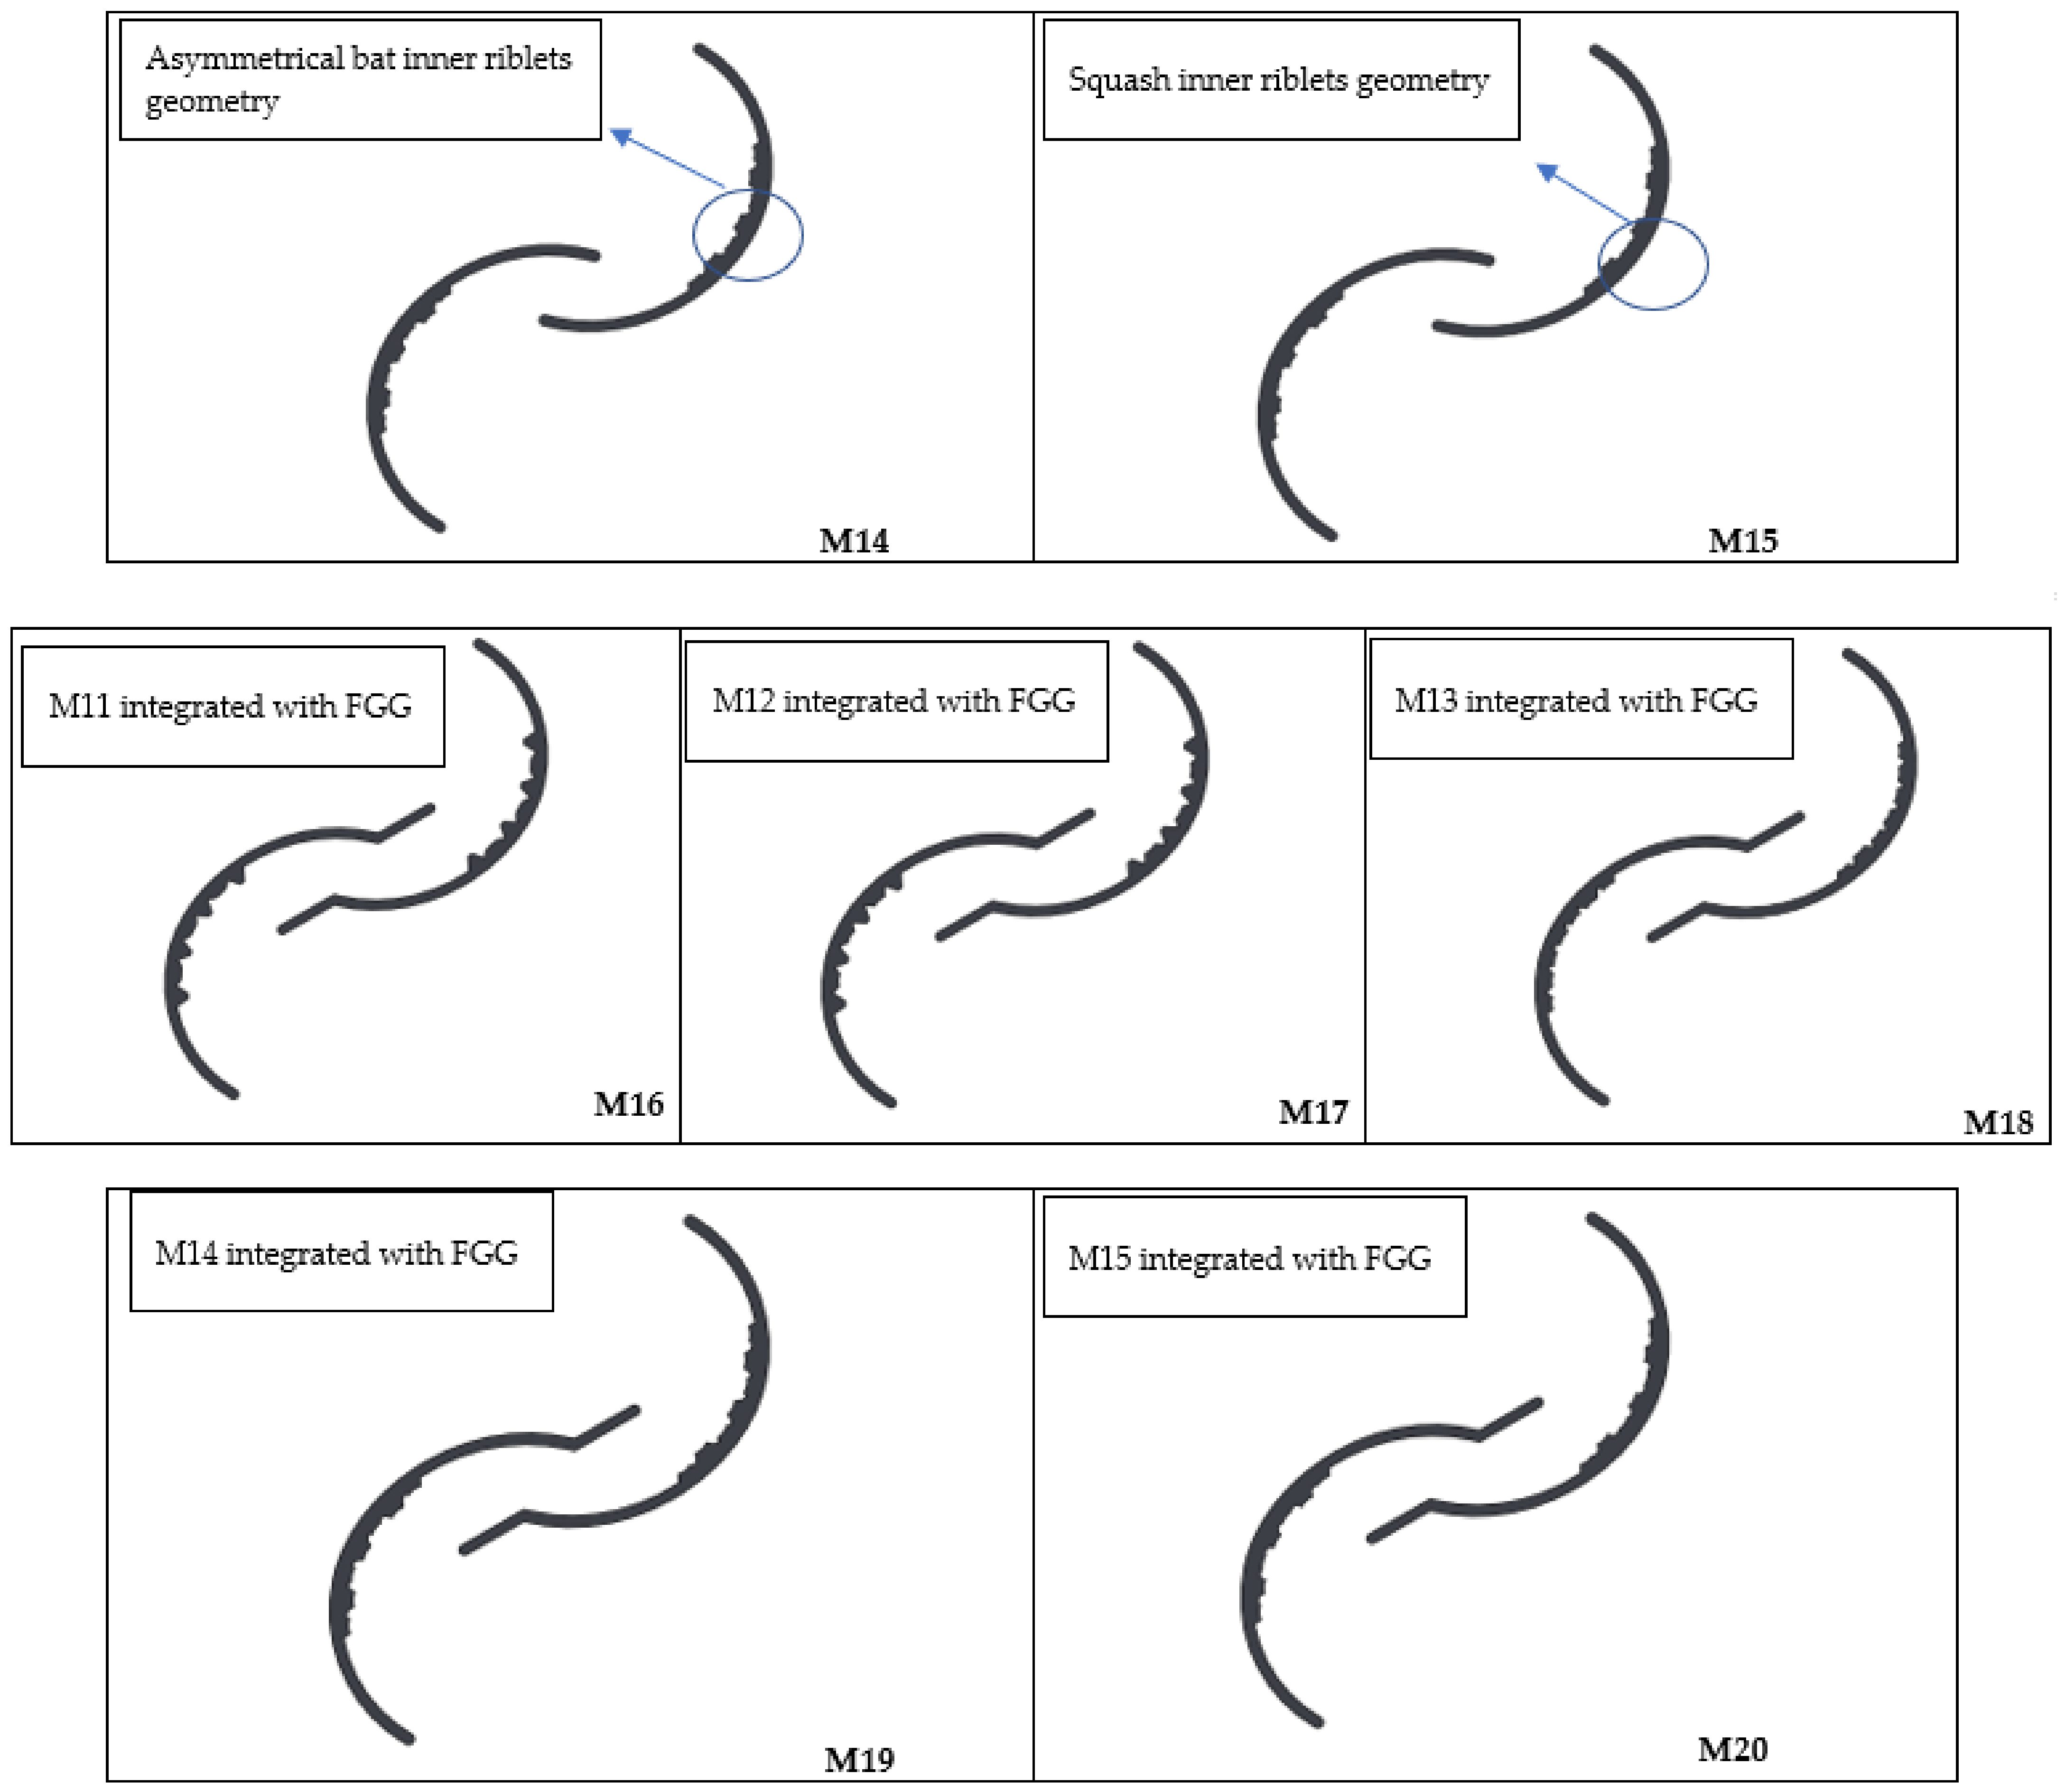
Figure 8 compares the maximum power generation in the reference model (
RM) and the modified model for each profile. Additionally, the enhanced performance of the modified inner blade profiles compared to the reference model is evident, signifying that the various profile configurations contributed to the overall improvement in performance. Models
M13 and
M18 displayed the most exceptional performance among the optimized inner blade profiles. Analyzing the
Cp values obtained for different configurations, it is evident that models 13 and 18 had notably higher
Cp values than the others.
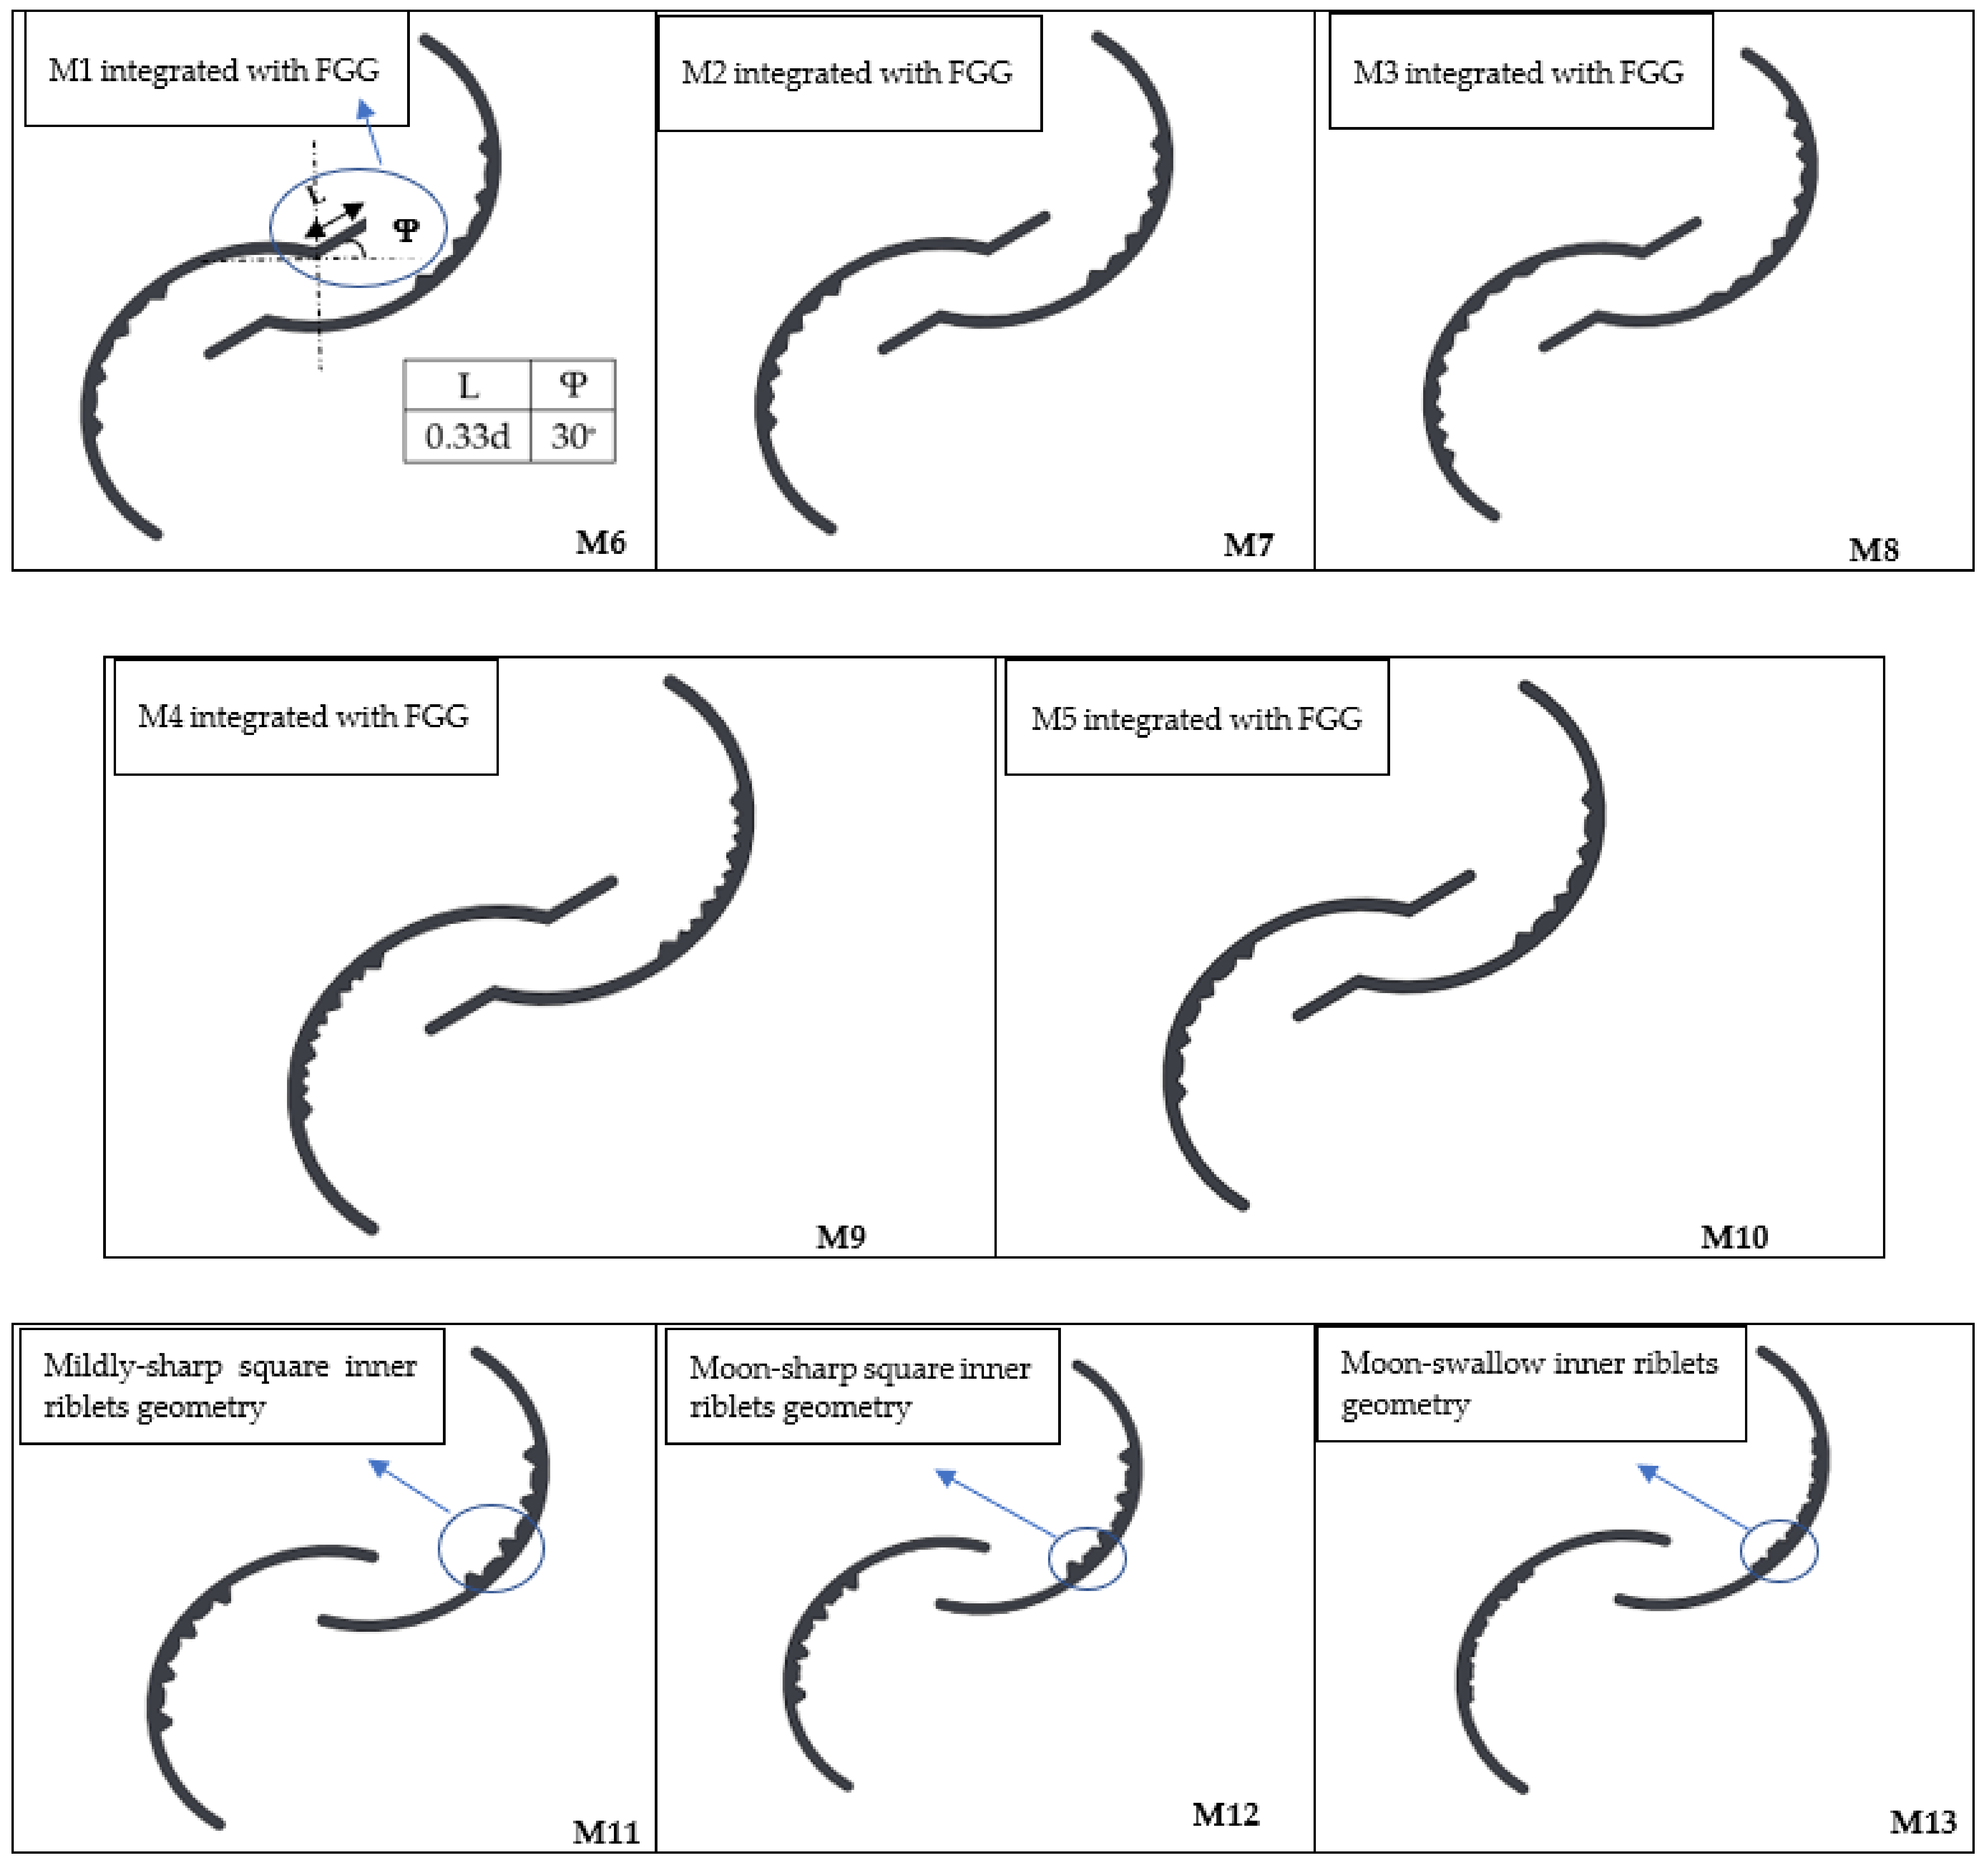
Figure 9 displays the variations in the numerical analysis results for the twenty selected blade profiles chosen to cover a comprehensive range of design possibilities. The relatively small difference in
Cp for several designs in
Figure 9 can be attributed to the presence of a gap guide flow integrated into the profiles. The development of flow near the entrance causes substantial turbulence, which impacts the overall performance of the various designs, resulting in less significant
Cp differences among the selected blades profiles.
6.2. Effects of Chosen Parameters on Overall Performance
The testing of the performance of an updated configuration of the Savonius rotor to evaluate the degree to which it has been improved was the second aim of this body of work.
Upon obtaining the optimal two-blade profiles (
M13 and
M18), as depicted in
Figure 6, these two profiles were investigated for level selection to identify the optimal parameters for further analysis. The full factorial design (
FFD) was employed to ascertain the significant influence of each control factor’s level on the target response. Consequently, the level with the most substantial impact was selected to enhance the
Cp value. The optimization procedure occurred at a Tip Speed Ratio (
TSR) of 1, selected to keep the rotor speed steady and manageable, thus streamlining the analysis. The data was evaluated using the
Minitab 17.0 software tool to determine the optimal design parameters.
Table 4 displays the outcomes of 8 iterations of each combination performed with
ANSYS CFX. The power coefficients are plotted against the values of three independent variables, the overlap ratio, the form of the blades, and the number of blades. Between eight experiments, the optimum configuration was found as
OR0.1BS2BN2. After identifying the optimal configuration,
OR0.1BS2BN2, further analysis was conducted to understand the underlying reasons for its superior performance compared to other configurations. This step involved examining the interactions between the independent variables and their effects on the power coefficient. It aimed to gain insights into the design characteristics contributing to improved aerodynamic performance and efficiency.
6.3. Evaluation of Optimal Design Parameters with ANOVA
An analysis of variance (
ANOVA) can be performed to evaluate if a significant connection exists between the control factor and the v response. The current
ANOVA results are grounded on a general linear model that includes a coefficient of determination employed to assess the model’s capacity to explain the observed data.
Table 5 displays the findings. After fitting a second-order multiple regression model with interactions, the R
2 value is 99.95%, R
2 (predicted) is 96.64%, and R
2 (adjusted) is 99.63%. These values suggest a robust relationship between the dependent variable (
Cp response) and the independent variables (control factors). The statistics highlight the significance of each parameter and their combined impact on the
Cp response, with a 5% risk. The
p-value denotes the probability of achieving these outcomes with a 95% confidence level and should be less than 0.05 to be deemed significant, according to [
36].
The relationship between the wind turbine’s performance metrics and its independent operational variables was examined by employing multiple regression analysis [
37]. Equation (12) presents a mathematical model representing the desired response regarding the modelled variables. The accuracy of the derived equation is assessed by analyzing its R
2 and adjusted R
2 values, which indicate the goodness of fit for the predicted relationship. The regression equation was developed to estimate the
Cp value of a Savonius rotor, and Equation (12) demonstrates how the response surface regression analysis can be used to obtain the finalized practical model based on coded coefficients.
Equation (8) represents the regression model that captures the relationship between the power coefficient (Cp) and the predictor variables, which include overlap ratio (OR), blade shape (BS), and blade number (BN). During the optimization process, the code is designed to search for the maximum Cp value by plugging in the domain values of the predictor variables. After analyzing the combinations, the optimal parametric values are identified as OR = 0.109, BS = 2, and BN = 2. These optimal values represent the OR0.109BS2BN2 design, which results from optimization. By substituting these values into Equation (8), the predicted power coefficient (Cp) is calculated to be 0.2706. This Cp value indicates that the OR0.109BS2BN2 design maximizes the power coefficient per the developed regression model.
6.4. Performance Analysis of the Optimized Profile
The simulations were performed using a computational system equipped with six processing cores and hardware specifications that include 16 GB RAM, a 512 GB SSD, and an RTX 2060 6 GB graphics card. Each simulation required 40-time steps per rotor rotation and took approximately five hours to complete. With a total of 29 iterations conducted in the optimization process to achieve the highest power coefficient and solution times, the entire simulation process spanned roughly 145 h. The use of six processing cores and the specified hardware allowed for efficient computation and facilitated the timely completion of the extensive simulations required for this study.
In this investigation, the primary goal was to optimize the power coefficient. The performance parameters, including the dimensionless power coefficient and generated power, were evaluated through 29 iterations of the optimization process to achieve the highest power coefficient and solution times. The outcomes presented in
Figure 10 demonstrate that the innovative turbine design “
OR0.109BS2BN2” attains a greater maximum power coefficient (
Cp) than the reference turbine. This achievement showcases the effectiveness of the computational approach and the hardware used in the study, yielding reliable and accurate results that informed the design optimization process.
The reference turbine has a maximum power coefficient (Cp = 0.2201) at a tip speed ratio (TSR) of 0.7. In contrast, the innovative turbine design “OR0.109BS2BN2” achieves a superior power coefficient (Cp = 0.2701) at a tip speed ratio (TSR) of 1. Compared to the reference model, the observed 22.8% enhancement in the power coefficient demonstrates that the innovative design “OR0.109BS2BN2” is more efficient and effective in converting wind energy into mechanical power than the reference turbine.
To further enhance performance, researchers calculated the maximum difference of optimal selection parameters between predicted and numerical results at a
TSR of 1, which was found to be 2.64%. This result demonstrates the accuracy and reliability of the regression equation in predicting the performance of the Savonius wind turbine. It is essential to set the operating parameters to their optimal values to optimize the wind turbine’s performance and achieve the highest projected level.
Figure 10 presents a performance comparison between the
OR0.109BS2BN2 design and the standard model. The
OR0.109BS2BN2 configuration exhibits improved performance compared to the baseline design, resulting in higher positive
Cp values. However, at a specific overlap ratio, increasing the ratio raises the rotor blockage ratio for the airflow between the blades, which may lead to a lower power coefficient. Therefore, the optimal blade design represents a balance between the increased incoming air velocity and the obstruction effect created by the narrowing of the passageway due to blade tip expansion. Overall, the innovative
OR0.109BS2BN2 design demonstrates improved performance and efficiency compared to the reference turbine while maintaining a balance between essential design factors.
6.5. Flow Structure Analysis
The Reynolds number for the wind turbine in this study, calculated to be approximately 91,580, indicates that the flow regime is turbulent, which plays a significant role in the turbine’s performance and efficiency. The turbulent flow structure analysis is crucial for understanding the complex interactions between the flow near the entrance, the rotor blades, and the local airflow dynamics. This turbulence affects the blades’ pressure distribution and aerodynamic forces, potentially leading to changes in the efficiency and power output of the turbine. Consequently, it is essential to consider these effects when designing and optimizing rotor blade profiles to maximize the wind turbine’s overall performance. The following sections will discuss the pressure distribution, blade interaction, flow velocity, and vortex formation that influence the performance of the studied wind turbine designs.
6.5.1. Pressure Distribution and Blade Interaction
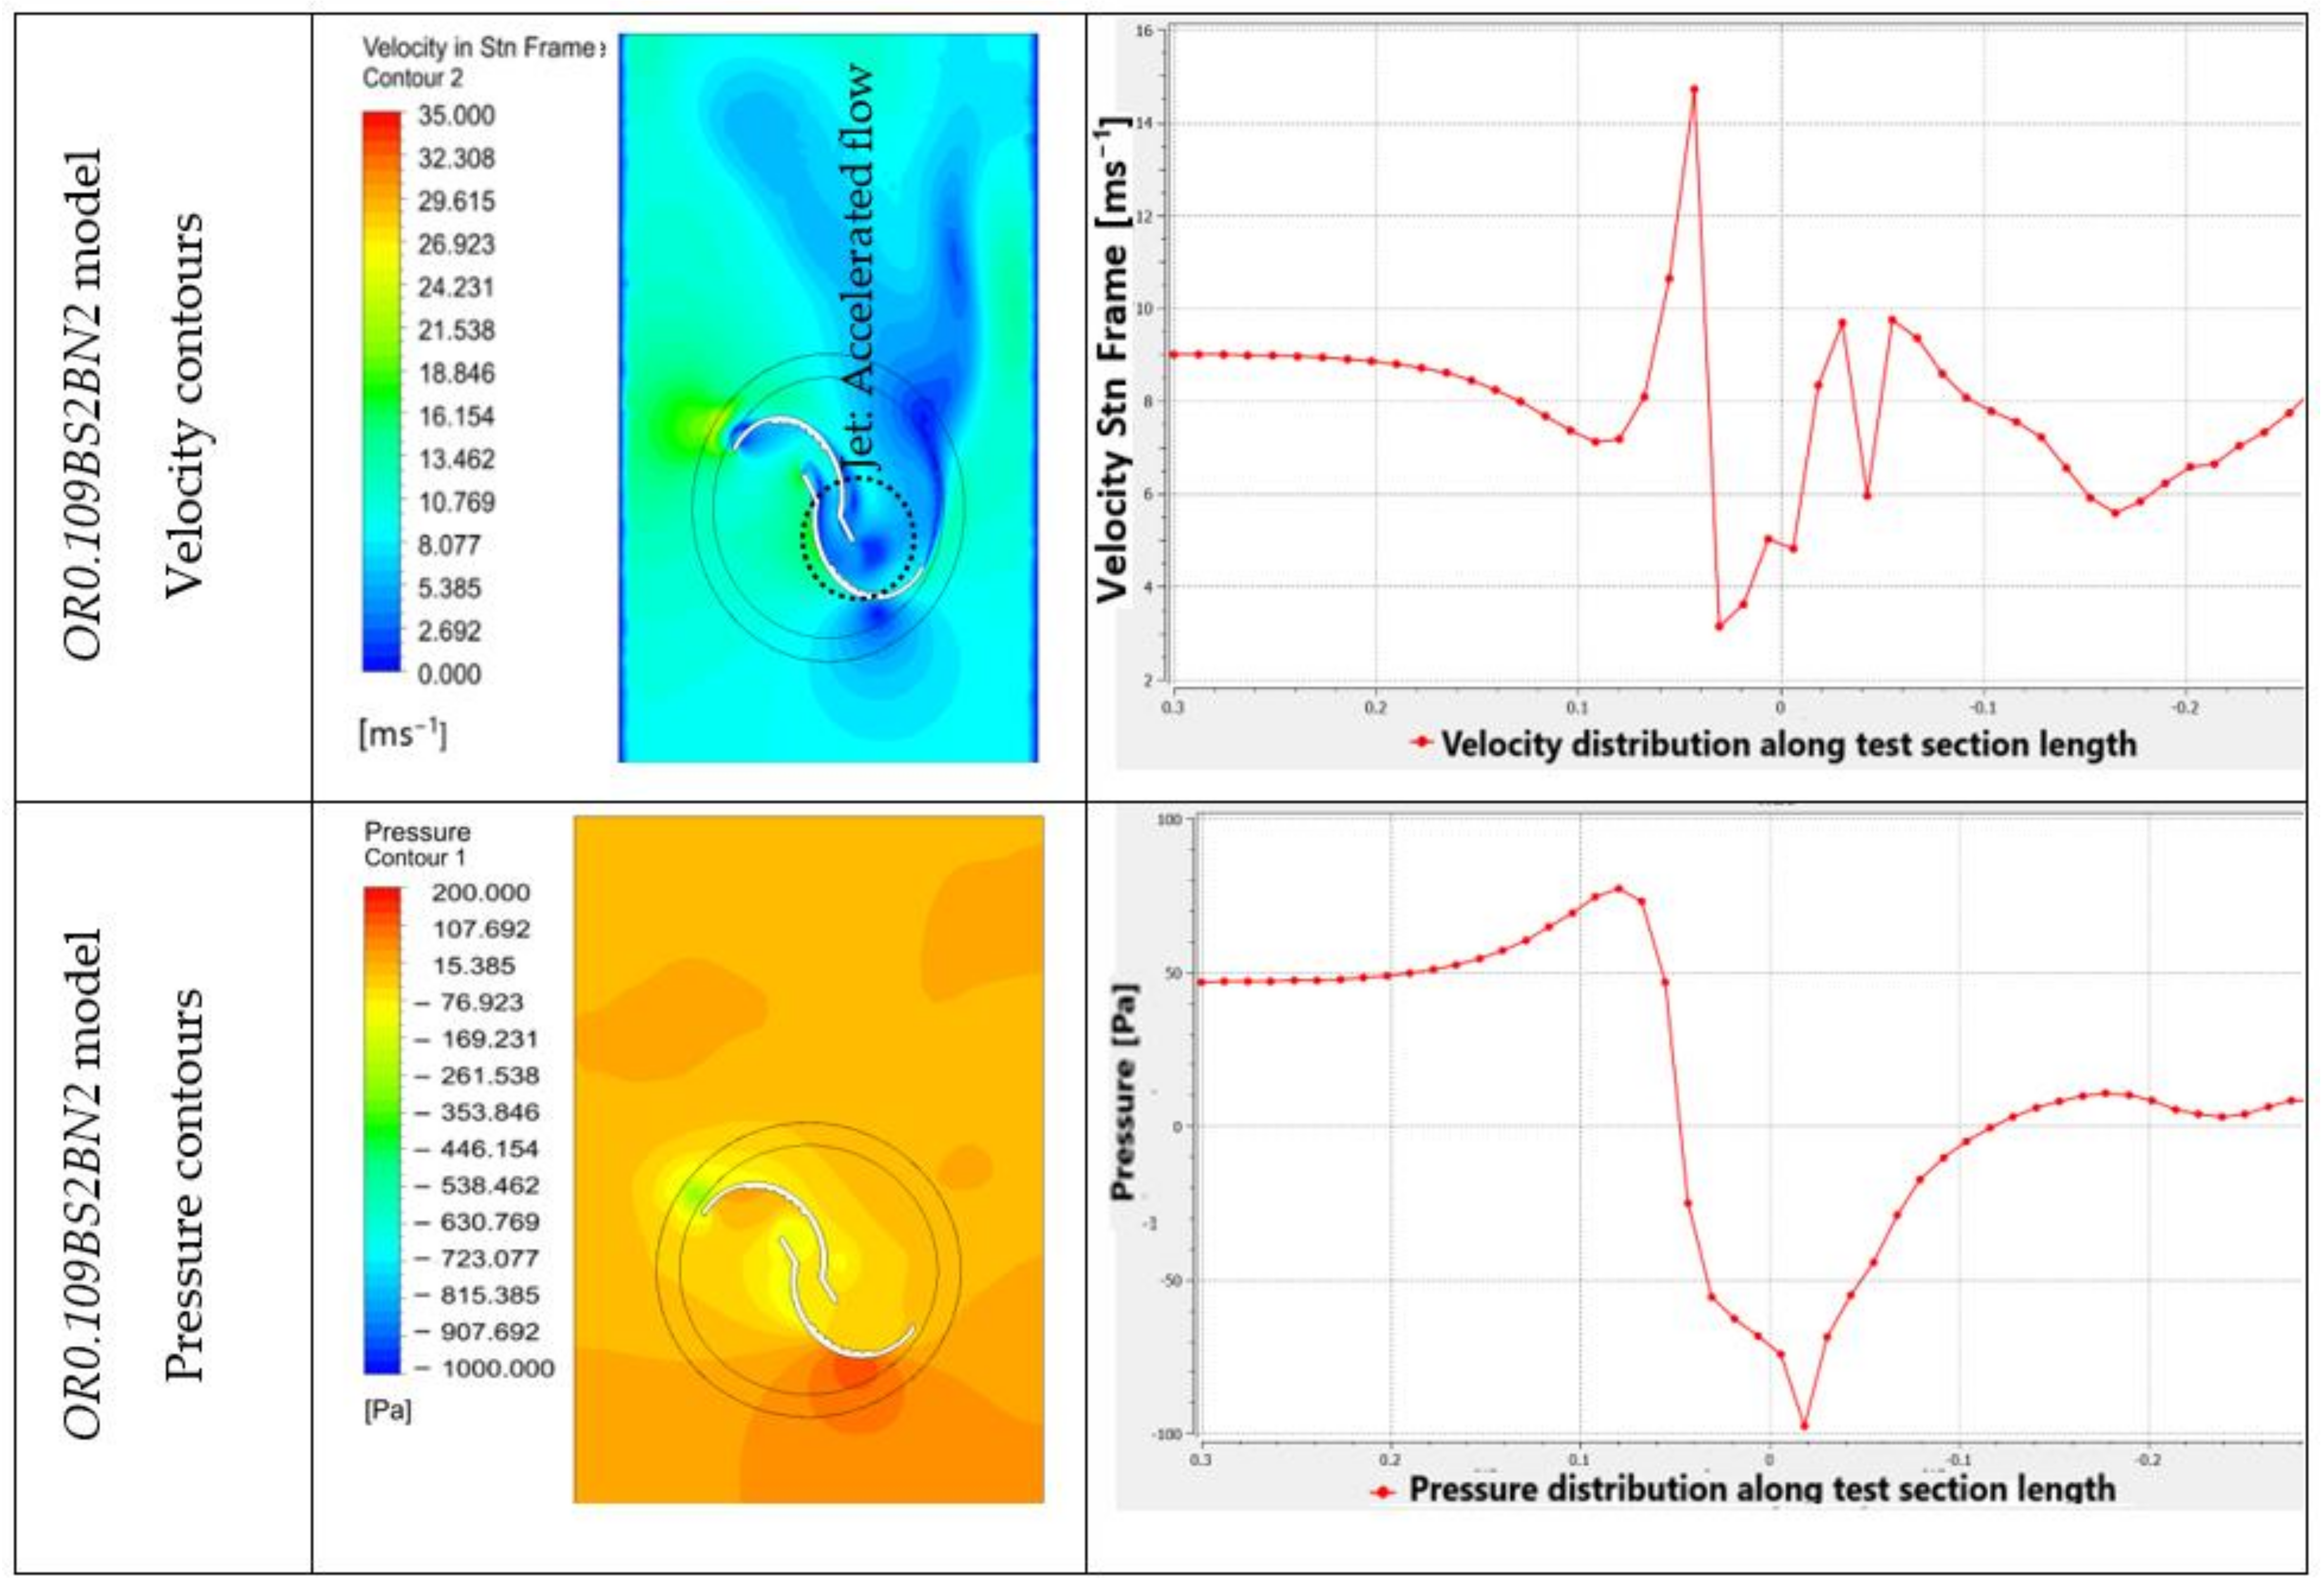
Figure 11 displays the contour plots for the pressure distribution of the different geometries, revealing the highest-pressure values for the reference model and
OR0.109BS2BN2 design at a
TSR of 1. This pressure distribution is the major source of the driving torque of the turbine at this position. In Savonius wind turbines, driving torque is generated through a drag-based mechanism due to the rotor blades’ pressure difference between the concave and convex sides. This method results in lower efficiency and rotational speeds than lift-based wind turbines such as
HAWTs and Darrieus
VAWTs, which rely on an aerodynamic lift to create driving torque.
For the reference model, the pressure distribution for the advancing blade ranged from 80 to 160 N/m2, while the returning blade varied from 160 to 20 N/m2. Conversely, the OR0.109BS2BN2 design’s advancing blade pressure ranged from 80 to 60 N/m2, and the returning blade pressure ranged from 60 N/m2 to 0. Positive pressures were noted on the inner face of the advancing blades, while negative pressures were detected near the rotation axis, on the returning blades’ inner side, and the advancing blades’ outer side.
In the OR0.109BS2BN2 design, the lowest pressure values were observed at the leading edge of the advancing blades, even lower than those of the reference model. These pressure differences are responsible for driving the rotation of the Savonius wind turbine. When the TSR values were increased, more negative pressure values were observed on the inner side of the returning blades, near the rotation axis, and on the outer side of the advancing blades. Additionally, the OR0.109BS2BN2 model exhibited significantly higher maximum pressure values than the reference model, indicating improved driving torque and overall performance.
6.5.2. Flow Velocity and Vortex Formation
At a
TSR of 1,
Figure 11 illustrates the velocity contours for both the reference model and the optimized model (
OR0.109BS2BN2). Counter-rotating vortices can be observed on the inner side of the returning blades, negatively impacting the rotor’s aerodynamic efficiency. The base design exhibits more vortex formation compared to the optimized design. The highest flow velocities occur at the tips of the advancing blades, where a dragging flow generates rotational torque through the lift effect, ultimately improving the wind turbine rotor’s performance.
The air velocity increases on the inner side of the advancing blades, leading to a more significant negative torque on the returning blades, a phenomenon known as jet overlap. The overlap jet is more pronounced in the optimized rotor, resulting in increased negative torque production. Furthermore, stagnation areas are present on the outer surfaces of the returning blades, reducing positive torques. At the leading edge of the advancing blade, high-velocity spinning vortices form, with wake regions developing downstream of the rotor. The reference model’s advancing blade velocity ranges from 5 to 14.5 m/s, while the returning blade velocity is between 4 and 9 m/s. In contrast, the optimized model’s advancing blade velocity varies from 5 to 15.25 m/s, and the returning blade velocity is between 2.5 and 7 m/s.
6.6. Flow through the Blade Gap Guide Flow
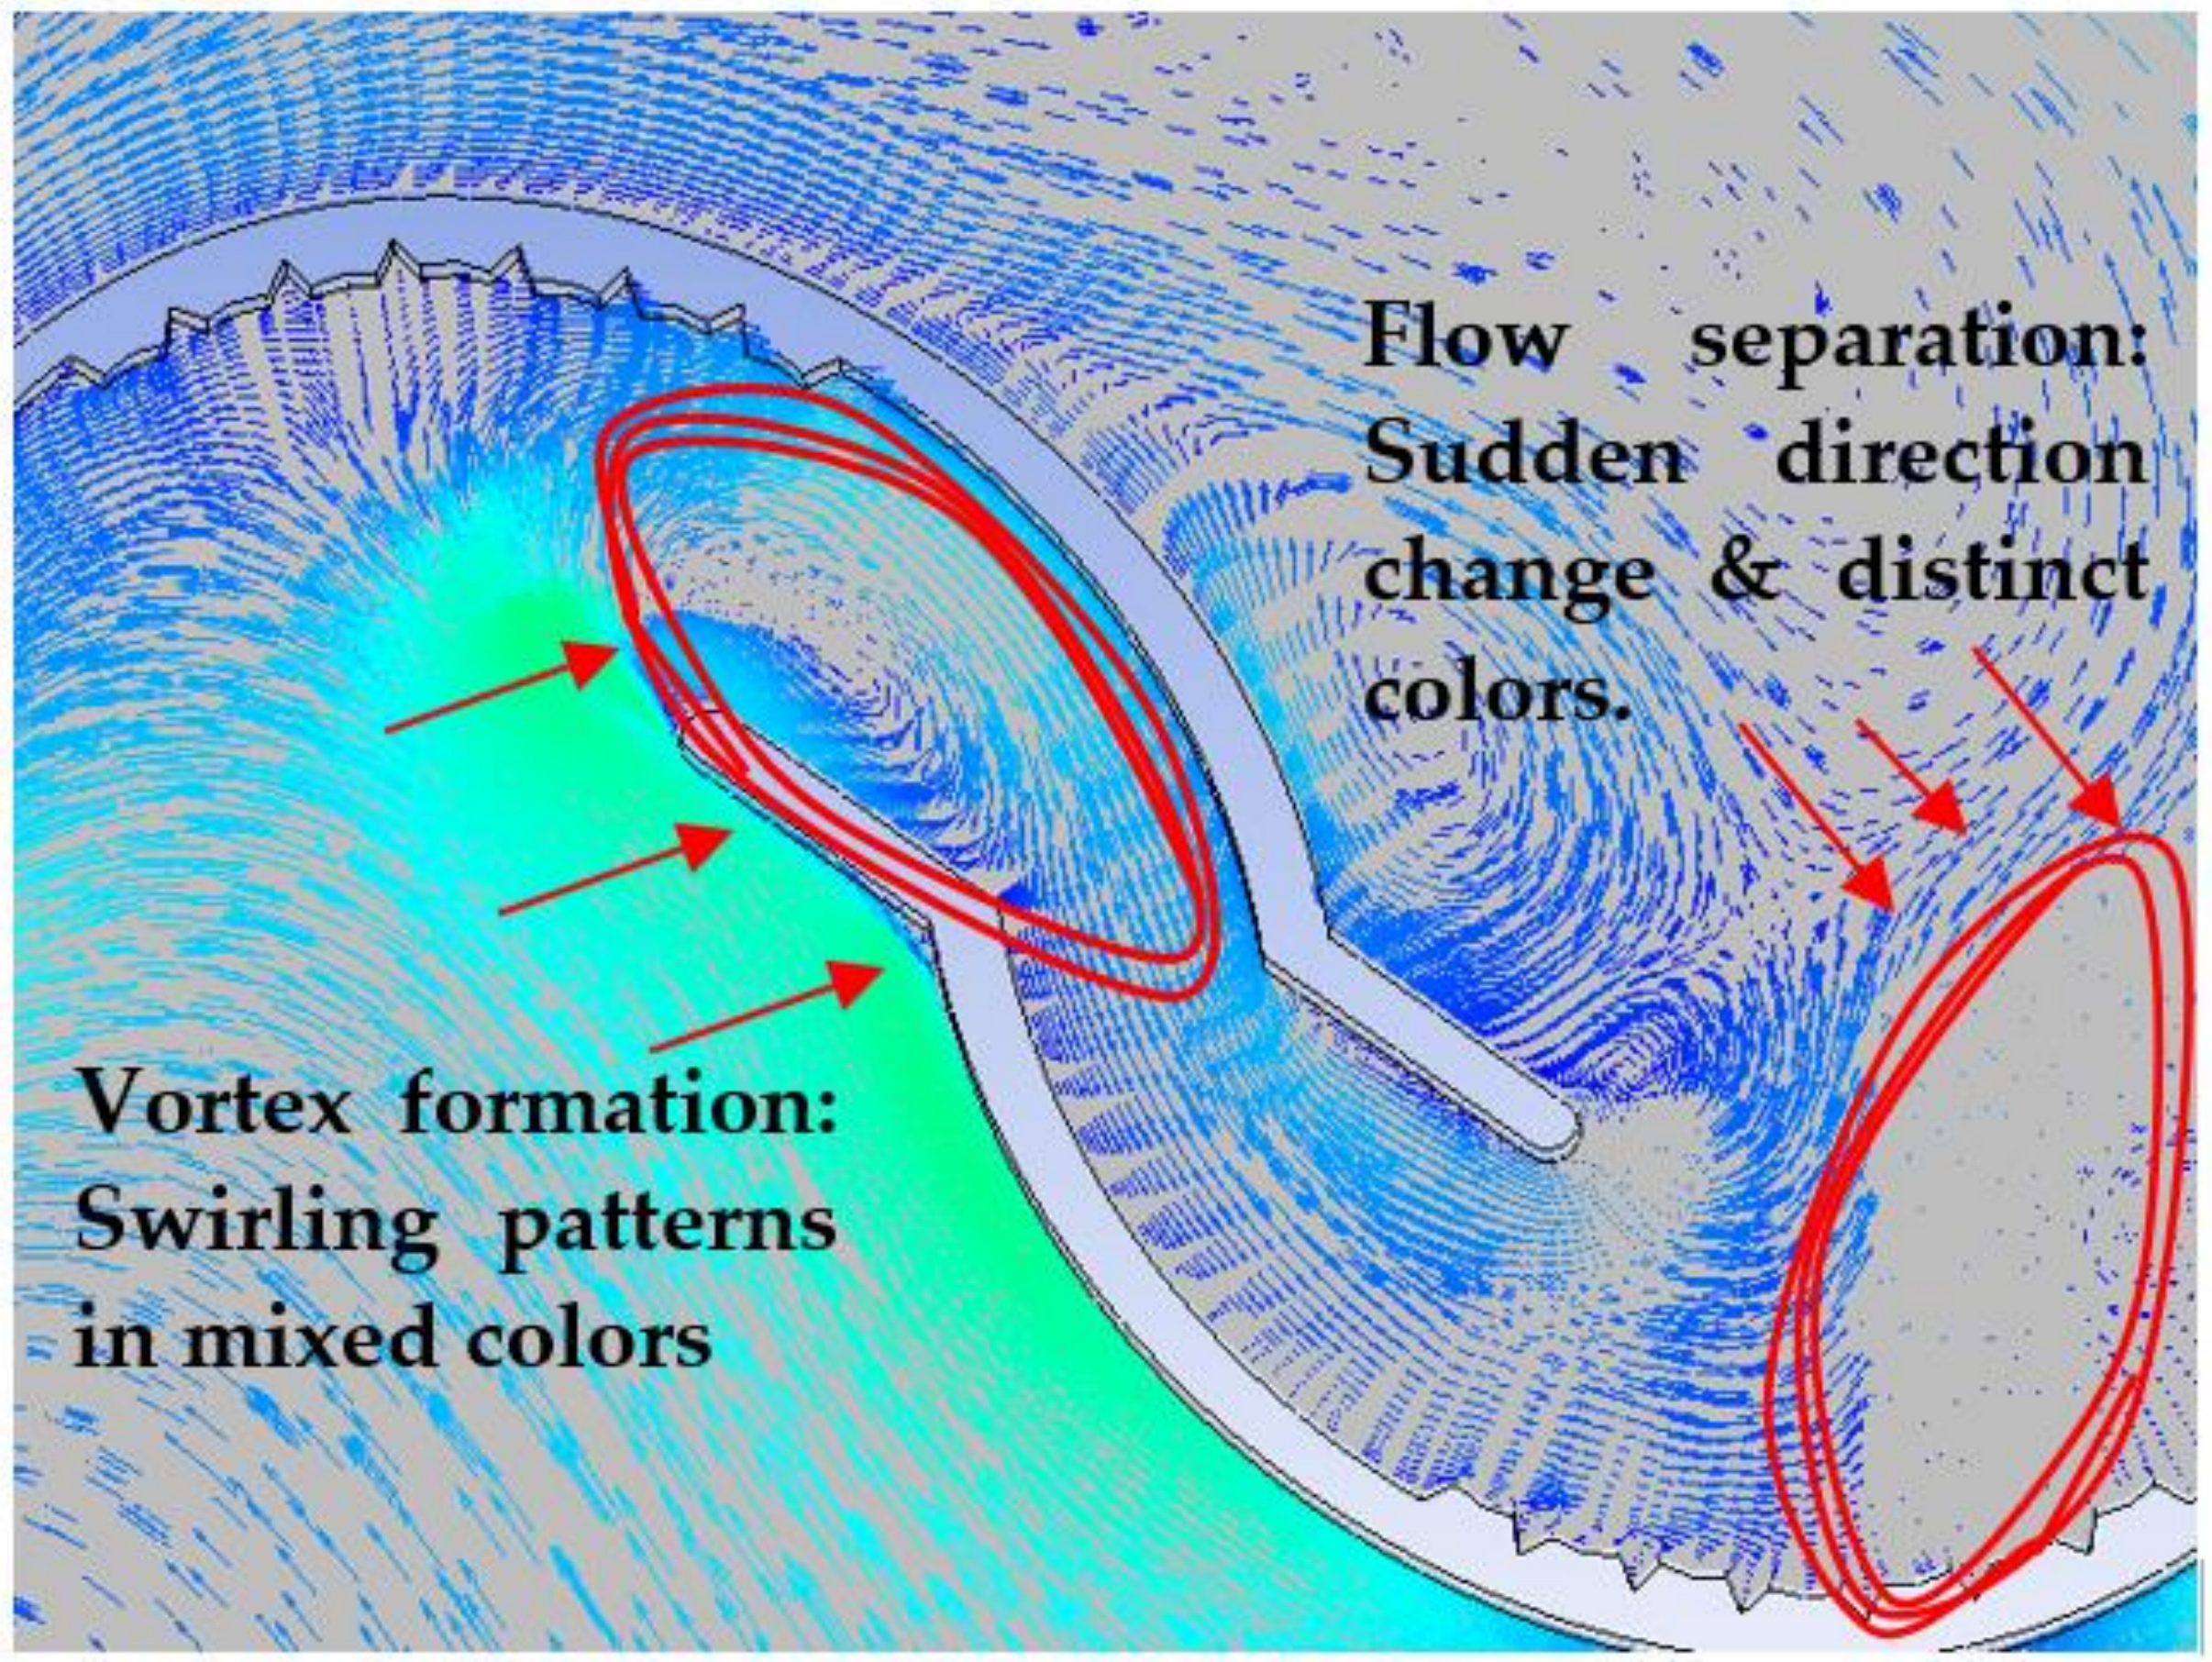
The flow within the gap between the rotor blades significantly influences torque fluctuations, with the gap vortex formation and evolution playing critical roles. The gap vortex, forming near the entrance to the gap during specific periods of the rotor’s rotation, is the most crucial factor. The blade edges’ geometry near the gap directly affects the vortex’s magnitude and development.
Innovative blade designs aim to minimize airflow reaching the convex blades through the flow guide gap (FGG), reducing negative torque and increasing the Savonius wind turbine’s power coefficient. However, modifying the blade edges’ design in the gap area involves a trade-off, as it can impact other aerodynamic factors. Consequently, it is vital to carefully consider these design aspects when improving the wind turbine’s performance.
Figure 12 highlights the complex flow patterns within the blade flow guide gap, specifically illustrating the areas where vortex formation and flow separation take place. The vortex formations occur in regions where the flow changes direction rapidly, causing the fluid to curl and create circular motion. Vortices can contribute to torque fluctuations in the blades and may impact the overall performance of the Savonius wind turbine.
Flow separation, on the other hand, happens when the flow detaches from the blade surface, creating an area of low pressure and recirculating flow. This phenomenon can lead to a decrease in lift and an increase in drag on the blade, ultimately affecting the turbine’s efficiency.
By understanding these flow behaviors within the blade gap, researchers can identify critical aspects of the rotor design that need to be optimized to minimize the negative effects of vortex formation and flow separation. An optimized blade design may lead to improved torque generation and overall turbine efficiency.
6.7. Experimental Results
To ensure the accuracy of the numerical simulation, researchers conducted a comparison with experimental data. Due to the measuring range limitations of the torque wrench, measurements could only be performed for TSR values less than 1.6 at a flow velocity of 9 m/s.
The absence of a digital torque meter placed on the rotor shaft to measure the dynamic torque could have provided more accurate measurements of the turbine’s performance. To address this limitation, incorporating a digital torque meter in future research could enhance the accuracy of the performance evaluation.
The experimental process included step-by-step stages to obtain precise measurements at different TSR values. This approach comprehensively understood the results and their correlation with the simulation data. Comparing the experimental findings with the numerical simulation led to a more reliable evaluation of the wind turbine performance.
At a flow velocity of 9 m/s, the turbine model operates at 1794
RPM, corresponding to a no-load condition.
Figure 13 shows the variation of power coefficients, with the highest value found for
Cp at
TSR = 0.264. In this case, the experimental values are lower than those obtained from the numerical simulation. The discrepancy can be attributed to the fact that the 3D numerical simulation does not consider the rotor’s central axis shaft in the flow field. However, these components must be addressed in the experimental setup, leading to overestimating power coefficients in the numerical simulation. Comparing and analyzing the experimental and numerical results can provide a more accurate assessment of the wind turbine’s performance.
The power coefficient variation increases, starting at 0.07 for a tip speed ratio (TSR) of 0.2 and peaking at 0.264 when TSR = 1. The average deviation of Cp across TSR ranges [0.2 to 1] and [1 to 1.6] is about 7%. Notably, the numerical curve closely aligns with actual data within the [1 to 1.6] TSR range, yielding accurate predictions with minimal errors.


 ,
, 


