
Comparative and Phylogenetic Analysis of the Complete Chloroplast Genome of Santalum (Santalaceae)


Research Institute of Tropical Forestry, Chinese Academy of Forestry, Guangzhou 510520, China
*
Author to whom correspondence should be addressed.
Forests 2021, 12(10), 1303; https://doi.org/10.3390/f12101303
Submission received: 12 August 2021
/
Revised: 17 September 2021
/
Accepted: 21 September 2021
/
Published: 24 September 2021
(This article belongs to the Section Genetics and Molecular Biology)
Abstract
:Santalum (Santalaceae, sandalwood) is a hemiparasitic genus that includes approximately 15 extant species. It is known for its aromatic heartwood oil, which is used in incense and perfume. Demand for sandalwood-based products has led to drastic over-harvesting, and wild Santalum populations are now threatened. Knowledge of phylogenetic relationships will be critical for the conservation and proper management of this genus. Here, we sequenced the chloroplast genome of 11 Santalum species. The data were then used to investigate chloroplast genome evolutionary dynamics and relationships and divergence time within Santalum and related species. The Santalum chloroplast genome contains typical quadripartite structures, ranging from 143,291 to 144,263 bp. The chloroplast genome contains 110 unique genes. The whole set of ndh genes and the infA gene were found to lose their functions. The P-distance among the Santalum species was 0.0003 to 0.00828. Three mutation hotspot regions, 14 small inversions, and 460 indels events were discovered in the Santalum chloroplast genome. Branch-model-based selection analyses showed that the Santalum species were under widespread purifying selection. Our phylogenomic assessment provides an improved resolution to the phylogenetic relationships of Santalum compared to the past analyses. Our divergence time analysis showed that the crown age of Santalum was 8.46 Mya (million years ago), the first divergence occurred around 6.97 Mya, and diversification was completed approximately 1 Mya. By sequencing the 11 Santalum species chloroplast genomes, we identified the variations in the Santalum chloroplast genomes. Using the chloroplast genome sequences, phylogeny and divergence time analyses discovered that the Santalum species were likely to originate due to radiation evolution, and most speciation events occurred less than 1 Mya.
1. Introduction
Sandalwood (Santalum L., Santalaceae) is known for its aromatic heartwood oil and is used in incense and perfume [1]. Santalum comprises 15 extant species and 14 varieties [2]. All sandalwoods are hemiparasitic plants, taking a portion of their water and nutrients from the roots of host plants. Santalum is distributed throughout India, Australia, and the Pacific Islands [3,4]. The Hawaiian Islands (with four species and four varieties) and Australia (with six species) were the distribution centers of the genus [2,5].
The sandalwood species were heavily exploited because of their high value and the demand for the valuable sandalwood oil. Santalum fernandezianum F.Phil., endemic to Juan Fernandez Islands, became extinct during the last century due to human exploitation [6]. Santalum freycinetianum Gaudich. var. lanaiense Rock from the Hawaiian Islands, S. insulare Bertero ex A.DC. var. hendersonense (F.Br.) Fosberg & Sacheét from Henderson Island, S. boninense (Nakai) Tuyama from the Bonin Islands, and S. insulare from the Cook Islands and French Polynesia [7] are now rare or threatened by extinction [8,9].
Santalum has been classified into five sections (Santalum, Solenantha, Hawaiiensia, Polynesica, and Eucarya) according to their morphological characters (Table S1) [3,4]. Section Santalum includes eight species and two varieties and is distributed in Australia, New Caledonia, Indonesia, India, Bonin Islands, Papua New Guinea, and Fiji. This section is the most widely distributed compared to other section species. Section Polynesica includes two species and eight varieties and mainly arelocated on the Pacific Islands. Section Eucarya is located in Australia and includes three species. The other two sections, Solenantha and Hawaiiensia, are located on the Hawaiian Islands. There has been much controversy about the boundaries and classifications of Santalum species among the taxonomies [3,10]. For example, the number of species in Hawaii is a controversy. Gaudichaud-Beaupré in 1829 descripted two species, the red-flowered S. freycinetianum and the white-flowered S. ellipticum Gaudich, and these two species formed a section (Santalum). Tuyama separated the Hawaiian members of section Santalum into two further sections [11]. Section Solenantha was characterized as having longer perianth tubes, smaller ovaries, and an absence of hairs proximal to the filaments, while section Hawaiiensia had white, green, brown, or orange corollas that were as wide as they were long, and inferior ovaries [4]. Currently, according to the treatment of Harbaugh and Baldwin [2], there are four species and four varieties in Hawaii, two species and two varieties in white-flowered section Hawaiiensia (S. ellipticum, S. ellipticum var. littorale (Rock) Skottsb. and S. paniculatum Hook. & Arn., S. paniculatum var. pilgeri (Rock) Stemmerm.), and two in the red-flowered section Solenantha (S. freycinetianum, S. freycinetianum var. lanaiense Rock, S. freycinetianum var. pyrularium (A.Gray) Stemmerm. and S. haleakalae Hillebr.). The species of S. majus H. St. John and S. involutum H. St. John are still unresolved in The Plant List database [12]. There remains confusion regarding some species, where the “distinction between taxa is often not clear-cut” [3], with morphological diversity within ranges and even within populations, for example, the red-flowered taxa, S. haleakalae and S. freycinetianum [13]. Reconstruction of the Santalum phylogeny showed that S. freycinetianum was not monophyletic [2]. Santalum freycinetianum var. pyrularium was a sister to S. insulare and the systematic position of two other varieties (var. freycinetianum and var. lanaiense) was not clear.
Another issue is that island populations with only weak morphological differences have been separated into different species. Meanwhile, morphologically similar populations on different islands were sometimes separated into distinct species [4]. Compared to using morphology alone, molecular data plus morphological data offer better opportunities to discover cryptic species and reveal evolutionary histories [14]. Several studies have used molecular data (e.g., the chloroplast genome marker trnK intron and the nuclear DNA markers ITS (internal transcribed spacer of ribosomal DNA) and ETS (external transcribed spacer of ribosomal DNA) to infer the phylogenetic relationships of Santalum [2,5,13,14,15]. The results showed the sections of Polynesica, Santalum, and Solenantha were not monophyletic and needed taxonomic revision [2]. The widespread Australian species S. lanceolatum R.Br. had been separated into two species, S. leptocladum Gand and S. lanceolatum [14]. The phylogenetic resolution achieved in these studies has been insufficient to confidently determine the evolutionary history of Santalum. Therefore, sampling of more genetic characters, such as complete chloroplast genomes, can provide a better phylogenetic resolution to help address the relationships within Santalum.
Chloroplast genomes are usually inherited uniparentally, without recombination and, thus, have an effective expansion of genetic information. The chloroplast genomes in angiosperms usually have a circular structure, ranging from 115 to 165 kb in length, and typical quadripartite structures, which consist of two copies of a large inverted repeat (IR) region separated by a large single-copy (LSC) region and a small single-copy (SSC) region. Phylogenetic analyses based on whole chloroplast genome sequences have been widely used at different taxonomic levels [16,17,18,19,20,21,22,23,24] and have provided effective genetic markers to resolve complex evolutionary histories [25,26,27]. Parasitic plants have partially or entirely lost photosynthetic activity, and are assumed to relax normal constraints on evolution of the chloroplast genome (plastome). The sequenced parasitic plant chloroplast genome revealed gene losses and genome rearrangements [28,29,30,31], with some holoparasite plastomes possibly losing or even losing most genes [32]. Most hemiparasites plants have retained photosynthesis, and their chloroplast genomes have only lost some genes, such as ndh [33]. A comparison of chloroplast genome sequences can help in understanding the evolutionary patterns of hemiparasitic plants.
To have a better understanding of the relationship within Santalum and to gain insight into the pattern of Santalum chloroplast genome evolution, we sequenced the chloroplast genome of 11 species of Santalum. Specifically, we attempted to (1) investigate the relationships within Santalum; (2) estimate the divergence time of Santalum; and (3) elucidate chloroplast genome evolution within hemiparasitic plants of Santalum.
2. Materials and Methods
2.1. Plant Materials and Sequencing the Chloroplast Genomes
We collected 12 individual samples, representing 11 currently described Santalum species. These species covered four sections of Santalum. Details of the 12 samples collected in this study are given in Supplemental Table S2. Specimens of these samples were preserved in the herbarium of the Research Institute of Tropical Forestry, Chinese Academy of Forestry. Xiaojin Liu identified all samples. Leaf tissues were dried using silica gel for subsequent DNA extraction. These materials were from cultivated plants, and permission was not required to collect them. We used the low-coverage whole-genome sequencing method to obtain the whole chloroplast genome. DNA was extracted using the modified CTAB (cetyl trimethylammonium bromide) DNA extraction protocol [34].
The qualified and purified DNA was fragmented by nebulization with compressed nitrogen gas, yielding fragments that were 350 bp in length. Paired-end libraries were prepared by the DNA Library Preparation Kit (Illumina, San Diego, CA, USA) with the following steps. First, the DNA fragments were end-repaired, phosphorylated, and A-tailed. Second, adapters were then ligated with index adapters. Finally, the ligated fragments were amplified for library construction. Sequencing was performed using the Illumina X-ten platform at Novogene. Each sample yielded about 4 Gb (Giga base) of data.
2.2. Chloroplast Genome Assembly and Annotation
The raw reads were filtered using Trimmomatic v0.36 [35] to remove the adaptors, low-quality reads and sites. The parameters were set as: LEADING = 20, TRAILING = 20, SLIDINGWINDOW = 4:15, MINLEN = 36, and AVG QUAL = 20. The clean data were used to assemble the chloroplast genome using GetOrganelle [36]. The chloroplast genome reads from the clean data were mapped to the complete chloroplast genome using Geneious Prime v2020.0.5. and the number of chloroplast genome reads were used to calculate the sequencing coverage of chloroplast genome.
Plant mitogenomes are notable for both their extraordinary variations in genomic size and their remarkable variability in structure and organization [37]. According to the results of Kan et al. [38], it is difficult to assemble a whole plant mitochondrial genome based on Illumina data. In this study, we did not analyze the mitochondrial genome.
The newly sequenced chloroplast genomes were annotated using Plann [39] using Santalum album (GenBank Accession number: MK675809) as the reference. The chloroplast genome maps were visualized using OGDRAW [40]. The complete chloroplast genome sequences were deposited in GenBank (MW464914 to MW464925).
2.3. Genome Comparison
The mVISTA program was used to analyze the variations in the Santalum chloroplast genomes [41], using the chloroplast genome of S. leptocladum as a reference for sequence annotation (GenBank accession number: MW464918).
The whole Santalum chloroplast genome alignments were performed with MAFFT v7 [42] and adjusted manually. We used the genetic P-distances and the number of SNPs (single nucleotide substitutions) to assess the variance among the Santalum species. The P-distances and the number of SNPs were calculated using MEGA X [43]. To explore the mutation hotspots in the chloroplast genome, nucleotide diversity (π) was calculated using the software DnaSP v6 [44], via sliding window analysis with a window size of 800 bp and a step size of 100 bp. The primers of the mutation hotspots were designed and synthetized to test their working efficiency, following the method of Dong et al. [45].
2.4. Natural Selection Test
The ratio (ω) of non-synonymous (dN) to synonymous (dS) nucleotide substitution rate served as an indicator of nature selection in protein-coding genes. The values ω > 1, ω = 1, and ω < 1 indicated positive, neutral, and negative selection, respectively. The rate of dS and dN, andωwere used to evaluate the evolutionary rate of the different genes and gene groups. All coding genes were aligned with MAFFT and deleted the stop codon. DnaSP v6 [44] was used to analyze the dN, dS, and ω. The average values of all pairwise calculated dN and dS were used to define the evolutionary rates of gene or gene groups. Gene with same functions were grouped following previous studies [46,47,48]. We analyzed the following gene sets: (1) concatenating all 67 coding genes; (2) gene sets corresponding to the same functions, for example, atp, pet, psa, psb, rpl, rpo, rps; and (3) the single genes.
In order to compare selection pressures acting on the chloroplast genome of Santalum species, we applied the branch-model method, implemented by CodeML in EasyCodeML [49], to estimate the ω of Santalum branches. We adopted two-radio models assuming that the branches of Santalum branches (foreground branches) had different ratios from the all other taxa (background branches). Significant difference was evaluated by likelihood ratio tests of maximum likelihood method [50]. The Maximum likelihood (ML) phylogeny tree based on the 70 g 50 s dataset with an hcluster partitioning scheme was used for the selection analyses.
2.5. Microstructural Mutation Events
Indels and small inversions were identified based on the aligned chloroplast genome sequence matrix, according to Dong et al. [51]. The indel types were divided into three categories: repeat-related indels, normal indels, and SSR-related indels (simple sequence repeat). Inversions were first identified using the REPtuter program and then checked and confirmed by reexamining the sequence matrix. Inversions form stem-loop structures, including the inversion sequences and inverted repeat.
2.6. Phylogenetic Analyses
Phylogenetic analysis was conducted to elucidate the interspecific phylogenetic relationships within Santalum. The complete chloroplast genome of other Santalales species were downloaded from GenBank, and coding genes were extracted using Geneious Prime v2020.0.5.
In order to compare the topology based on different datasets, we generated two datasets for phylogenetic inference. The first dataset (13CPG) was the 12 Santalum complete chloroplast genome sequences with Osyris wightiana Hochst. & Steud. as an outgroup. The second dataset (70 g 50 s) contained 66 coding genes and four rRNA genes, covering 12 Santalum samples and 38 Santalales species from nine other families.
Maximum likelihood (ML) and Bayesian inference (BI) methods were used to infer phylogenetic relationships. For the 13CPG dataset, the best-fit model was found with ModelFinder [52]. For the 70 g 50 s dataset, we used the following partitioning schemes: (1) unpartitioned; (2) partitioned by genes; (3) partitioned with the rcluster algorithm (data pre-partitioned by locus); and (4) partitioned with the hcluster algorithm (data pre-partitioned by locus). All partitioning analyses were run in PartitionFinder 2 [53] under the model selection AICc, and with the branch length linked. RAxML-NG [54] was run for the ML tree with 500 bootstrap replicates. RAxML-NG is a from-scratch re-implementation of the established greedy tree search algorithm of RAxML/ExaML and it offers improved accuracy and speed.
Mrbayes v3.2 [55] was used to perform the BI tree. For the 70 g 50 s dataset, we used the hcluster partitioning scheme for BI analyses because this scheme resulted in the highest log-likelihood in the ML analyses. The 13CPG dataset used the GTR + G model (the best-fit model from ModelFinder) for BI analyses. The BI analysis was run with two independent chains for 20 million generations with sampling every 1000 generations. The initial 25% of the sampled trees were discarded as burn-in. The stationarity was regarded as having been reached when the average standard deviation of split frequencies remained below 0.01. We used Tracer v1.6 [56] to evaluate convergence and ensure sufficient and effective sample sizes for all parameters surpassing 200.
2.7. Molecular Clock Dating
The 70 g 50 s dataset was used to estimate the divergence times of Santalales using five priors. The root age of the tree (crown age of Santalales) was set to 114 Mya (95% HPD: 112–116 Mya) according to the divergence time estimate of the angiosperms [57]. The stem age of Loranthaceae was constrained to 72 Mya (95% HPD: 70.4–73.6 Mya) based on the fossil of Cranwellia [58,59] and the results of Liu et al. [29], and the average age of the most recent common ancestor (MRCA) of Loranthaceae was set to 59 Mya (95% HPD: 57.4–60.6 Mya). The stem age of Viscaceae was 72 Mya (95% HPD: 70.4–73.6 Mya) according to Vidal-Russell and Nickrent [60]. The split age of Santalum and Osyris was set using the external calibration of 32–48 Mya, as estimated by the fossil-calibrated of Harbaugh and Baldwin [2] and Wikström et al. [57].
The divergence time of Santalales was determined in BEAST 2 [61]. BEAST analyses were done using the uncorrelated lognormal relaxed molecular clock model, which is considered the most appropriate model for species-level datasets [61]. The prior tree Yule model was selected, and the Markov Chain Monte Carlo (MCMC) tool was run for 400,000,000 generations with sampling every 10,000 generations. We conducted two separate MCMC runs and used Tracer v1.6 [56] to evaluate convergence and ensure sufficient and effective sample sizes for all parameters surpassing 200. A maximum credibility tree was then built using TreeAnnotator v2.4.7, with the initial 10% of trees discarded as burn-in.
3. Results
3.1. Structural Characteristics of the Santalum Chloroplast Genome
The complete chloroplast genomes of Santalum species were assembled into circular molecules, contained the typical quadripartite structures (Supplemental Figure S1). The Santalum chloroplast genome sequencing coverage was from 205× to 8629× (Supplemental Table S2). The Santalum chloroplast genomes ranged from 143,291 bp (S. acuminatum (R.Br.) A.DC.) to 144,263 bp (S. boninense) in length (Table 1), with LSCs (large single copies) of 82,944 bp (S. acuminatum) to 83,942 bp (S. paniculatum), IRs (inverted repeat) of 24,477 bp (S. paniculatum) to 24,511 bp (S. album L.), and SSCs (small single copy) of 11,237 (S. leptocladum) to 11,379 bp (S. acuminatum). The overall GC content was 38.0%.
The Santalum chloroplast genomes encoded a total of 110 unique genes, including 67 protein-coding genes, 30 tRNA genes, 4 rRNA genes, and 9 pseudogenes. The whole set of ndh genes and the infA gene were found to have lost their functions. The ndhA gene had a complete loss of function, and the other ndh genes and infA were pseudogenizations. Sixteen genes had introns, with two (ycf3 and clpP) harboring two introns.
3.2. Comparative Analyses of the Chloroplast Genome
The mVISTA results revealed collineation, no rearrangement, and high sequence similarity across the chloroplast genome (Figure 1). There were 2352 variable sites in the 145,671 bp Santalum chloroplast genome alignment (Table 2). The overall nucleotide diversity (π) was 0.0036. SSC exhibited the highest π value (0.00926) compared with the IR (0.00087) and LSC (0.00457) regions. The genetic p-distance and number of nucleotide substitutions among these ten Santalum species are given in Supplemental Table S3. The mean genetic distance was 0.00401, the lowest sequence divergence was between S. ellipticum and S. ellipticum var. littorale, and the largest sequence divergence was between S. spicatum and S. yasi.
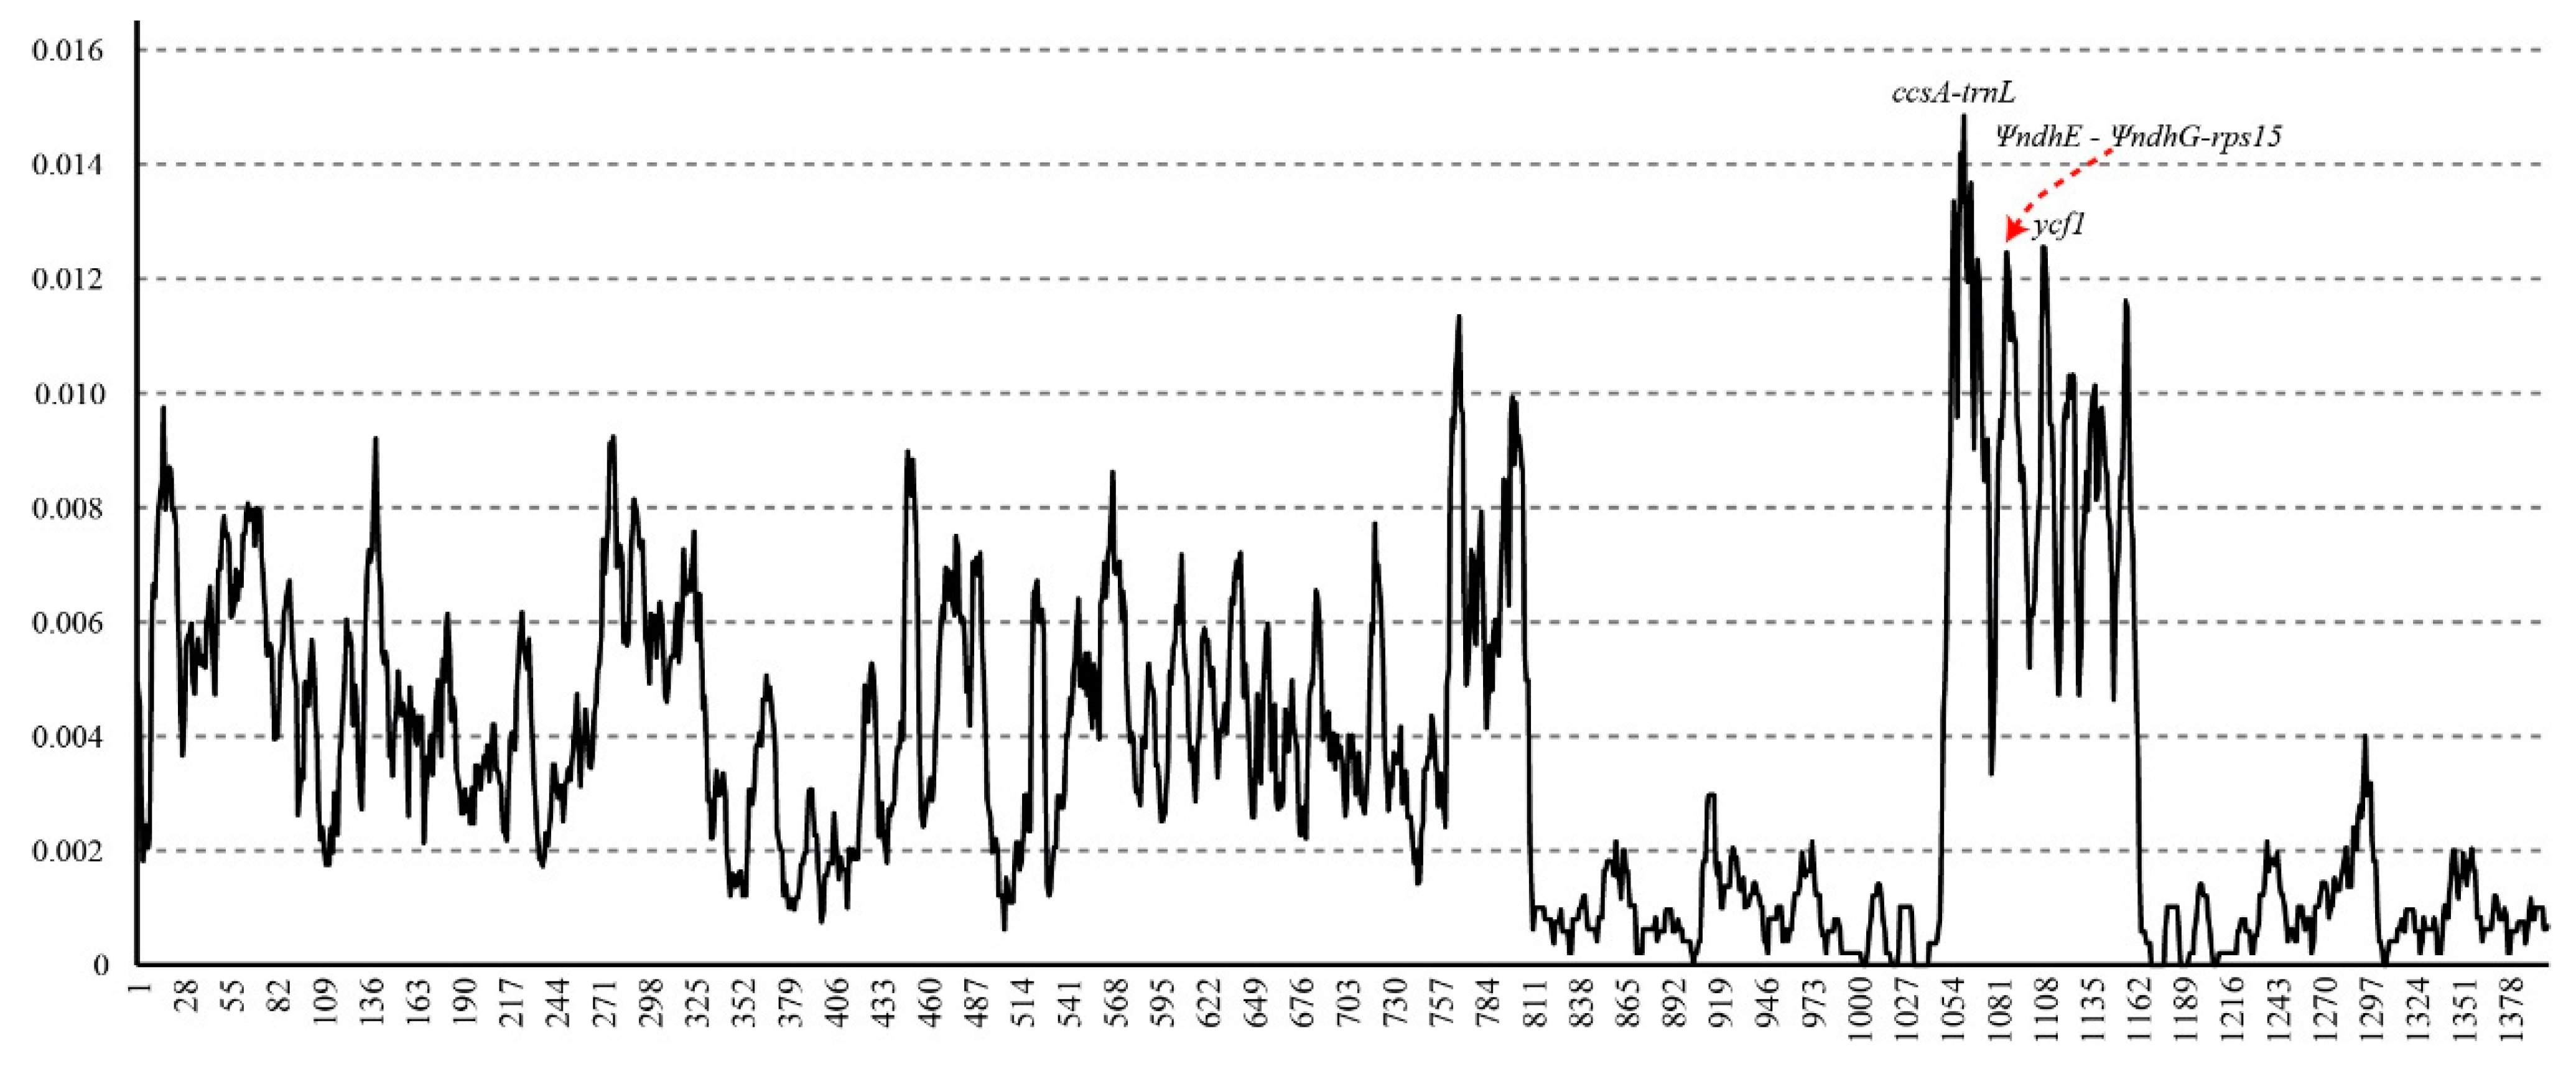
To identify the mutation hotspots in the chloroplast genome, the nucleotide diversity values are shown in Figure 2. The number of single nucleotide substitutions ranged from 0 to 46, and the π values ranged from 0 to 0.01485 within an 800-bp sliding window size. We defined mutation hotspots with pi values > 0.012. There were three regions (ccsA–trnL, ΨndhE–ΨndhG-rps15, and ycf1), and these three regions were all located within the SSC region. Among these three regions, ccsA-trnL had the highest nucleotide diversity values.
The most commonly employed loci used in plant phylogeny and DNA barcoding (e.g., rbcL, matK, trnH-psbA) were not selected in our study. We compared the sequence divergence of highly variable regions and the three conventional candidate chloroplast DNA barcodes (matK, rbcL, and trnH-psbA). Sequence variation values, such as genetic distance, nucleotide diversity, and the number of variable sites were given in Supplemental Table S4. The three newly identified markers (ccsA–trnL, ΨndhE–ΨndhG-rps15, and ycf1) had a higher genetic divergence and more information sites than the three conventional candidate chloroplast DNA markers. The primers designed for the three variable markers are given in Supplemental Table S5 and the primers were work well (Supplemental Figure S2).
3.3. Natural Selection
Using the branch-model method, the Santalum branch had a significantly lower ω ratio (ω = 0.072; p < 0.001) than all other branches (ω = 0.151). This result indicates that Santalum may have been shaped by stronger purifying selection.
The average values of dS, dN and ω are shown in Supplemental Table S6. Among these genes, 11 genes had dS = 0, 23 genes had dN = 0, and 7 genes (petG, petN, psaC, psbI, psbL, psbN, and rpl36) had both dN and dS = 0. The highest dS value gene was rps19 (0.041), followed by rps15 (0.032) and rp32 (0.031). The highest dN value gene was ccsA (0.0093), followed by rps15 (0.0082) and ycf1 (0.0078). Most of genes showed ω < 0.5 except rps3, ycf1, matK, rpl33, and rps7. Within the gene groups, rps exhibited the highest dS value and the pet showed the lowest. The rps also showed the highest dN value and the psa with the lowest. The photosynthetic genes (psa and psb) showed the lowest ω compared to other genes (Figure 3). Concatenating all 67 coding genes exhibited a higher synonymous substitution than non-synonymous substitutions, and the ω was 0.302.
3.4. Microstructural Mutation Variable
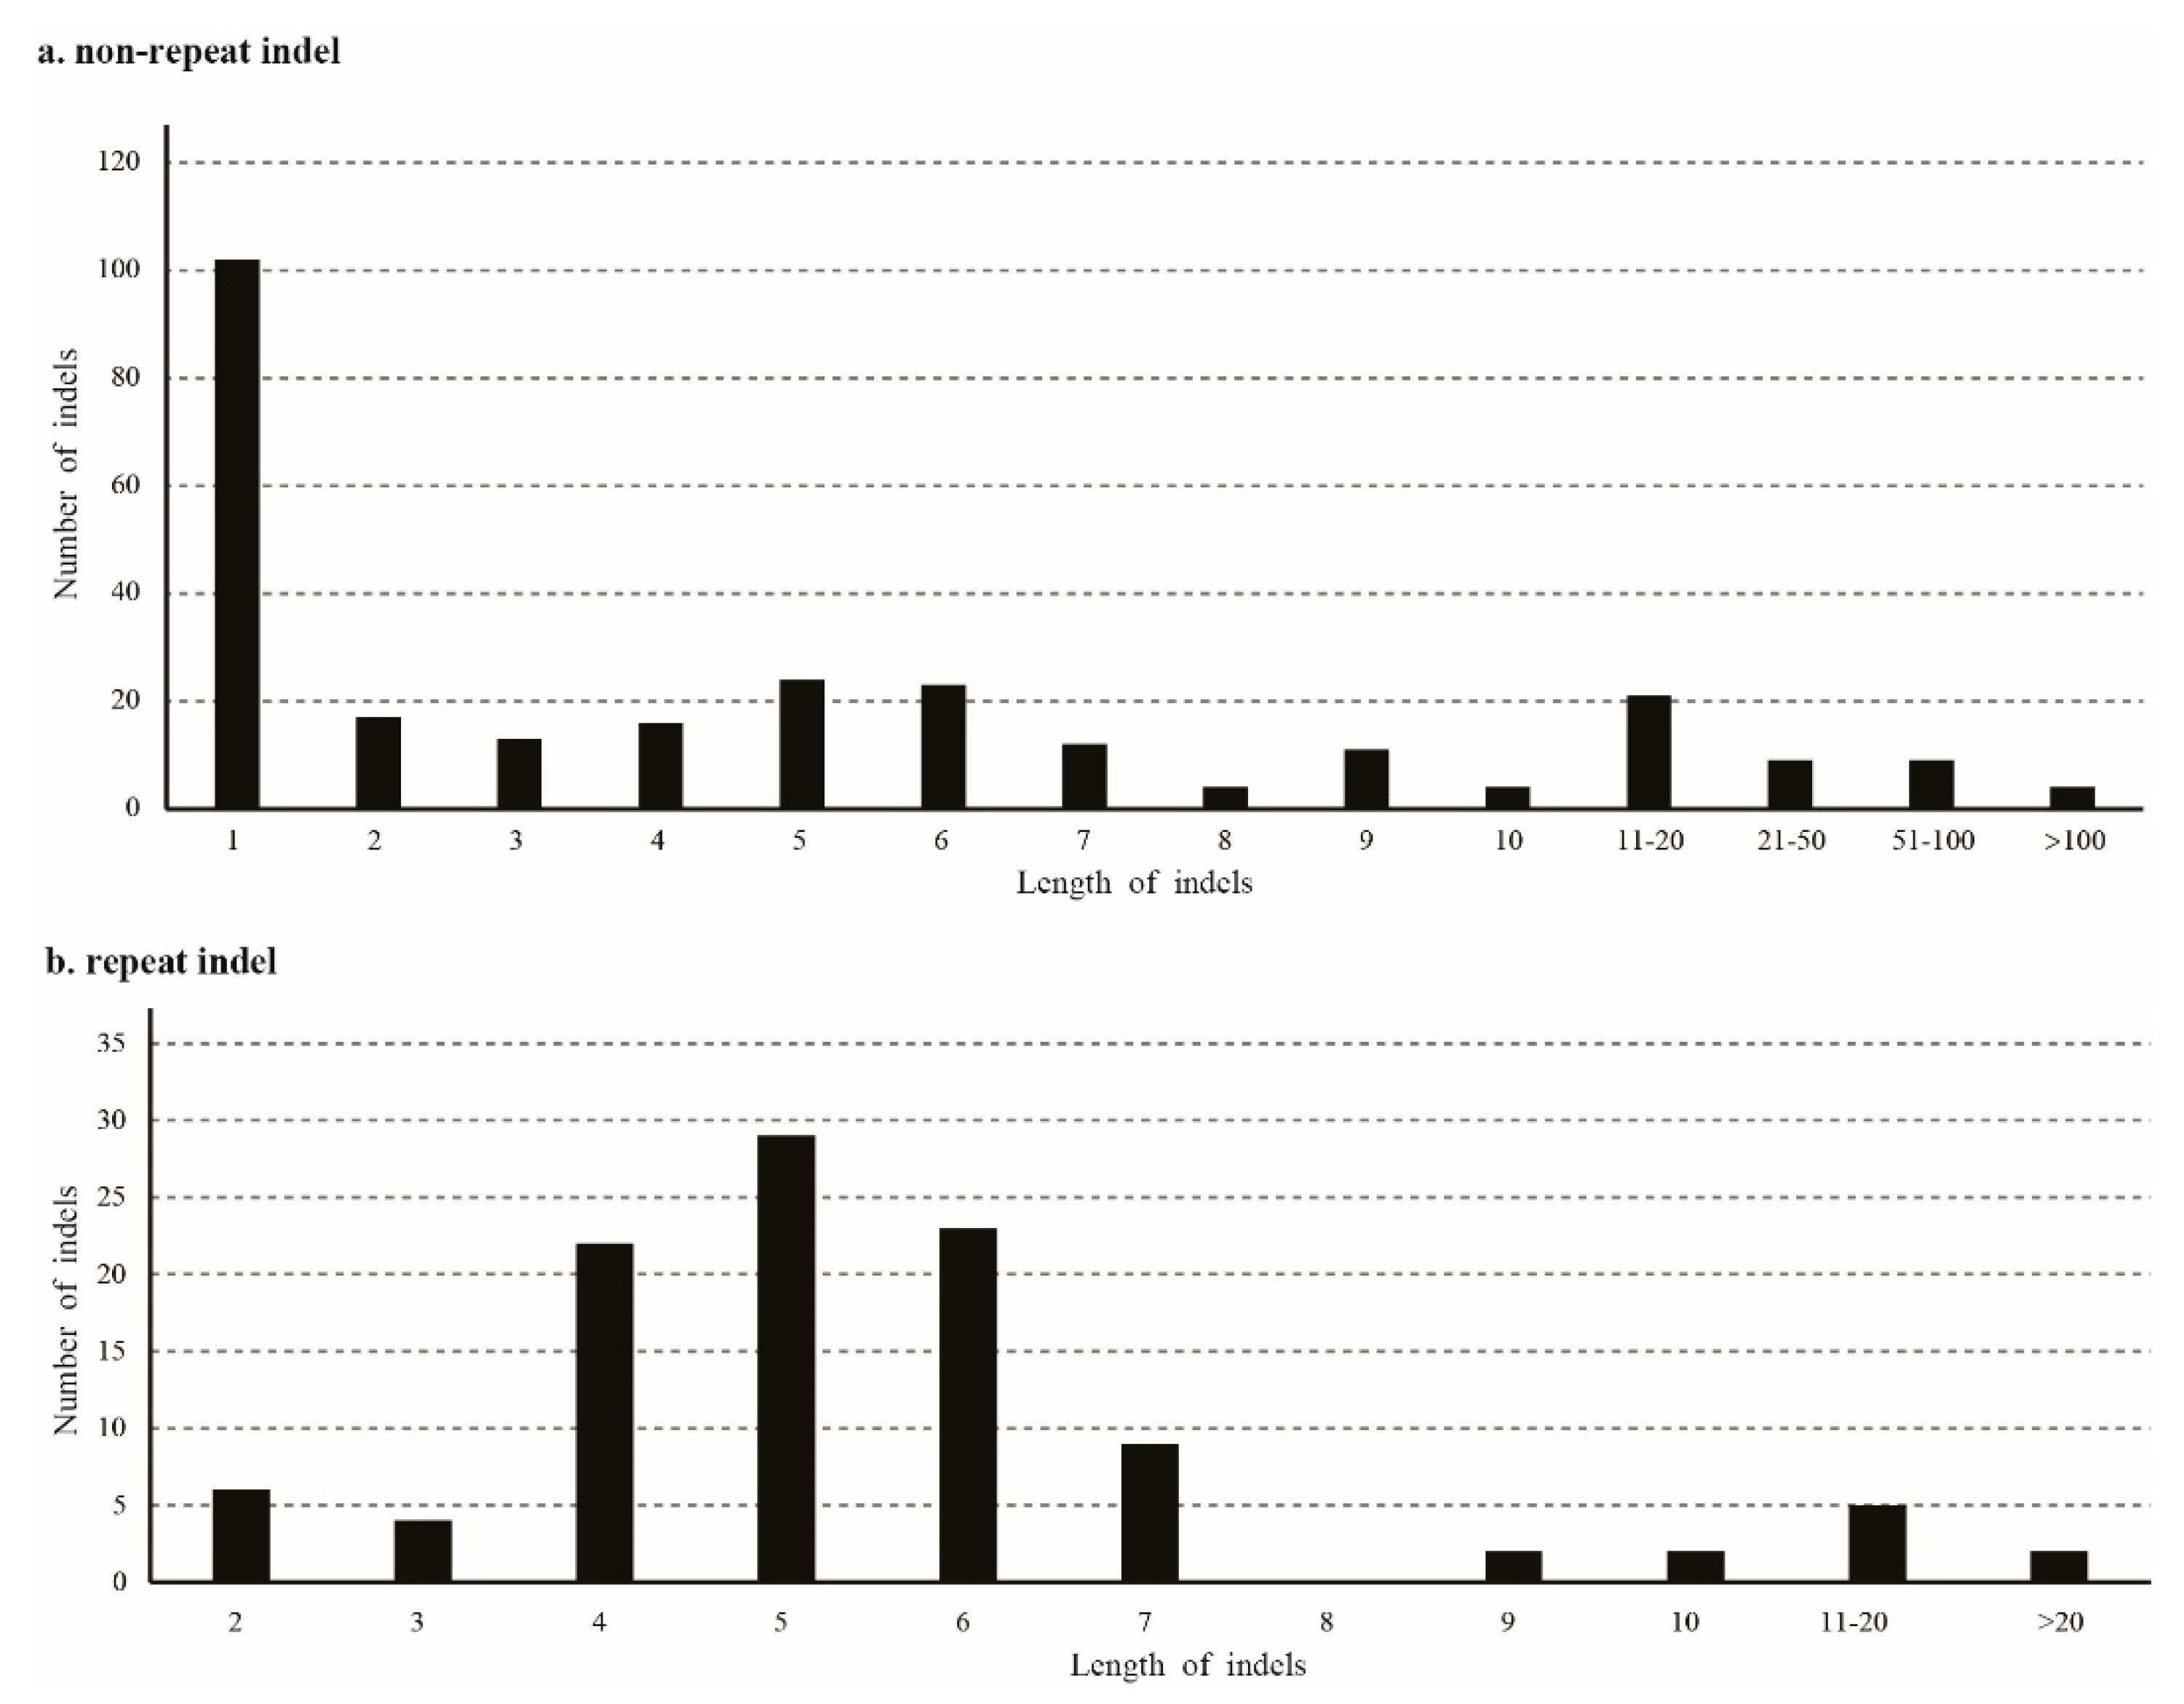
Among the chloroplast genomes of Santalum species, there were 460 indels in total, including 269 normal indels, 104 repeat-related indels, and 87 SSR-related indels. Most of the indels (77.17%, 355 times) were in the spacer regions, 57 indels were found in the intron regions (12.39%), 26 indels occurred in the pseudogene regions, and 22 indels were found in the exon regions. All SSR-related indels were located in non-coding regions. The length of the normal indels ranged from 1 to 331 bp (Figure 4), and 1-bp indels were the most type (37.92%). The longest normal indel occurred in the ycf4-cemA region, and was a deletion in S. spicatum. Repeat related indels ranged from 2 bp to 28 bp; the longest indel was located in atpH-atpI and was an insert in S. boninense, S. paniculatum, and S. ellipticum var. littorale. Most of the repeat-related indels were 4 to 6 bp long (71.15%). A total of 109 regions had indels: ycf3-trnS had 17 indels, followed by trnL-rpl32 (15 indels), rps16-trnQ (14 indels), atpH-atpI (13 indels), petA-psbJ (12 indels), and matK-rps16 (12 indels). For the coding regions, the ycf1 gene had the most indels (9 indels).
Fourteen small inversions were identified in the Santalum chloroplast genome. All of the inversions and their inverted repeating flanking sequences formed stem-loop structures. The inversion lengths were from 2 to 33 bp, and the franking repeats were from 7 bp to 25 bp (Supplemental Table S7). There was no correlation between the length of inversion and the flanking repeats sequences. Seven inversions occurred in the LSC regions; four were located in the SSC region, and three in the IR regions. All the inversions were located in non-coding regions. Five inversions (in ndhB, rpl33-rps18, rps15-ycf1, trnH-psbA, and trnM-atpE) were specific to S. acuminatum. The inversion in ndhD-psaC occurred in S. spicatum, while the inversions in trnL-rpl32 and petN-psbM were specific to S. album. S. album had one sample with inversions at ycf2-trnL and psaJ-rpl33.
3.5. Phylogenetic Inference
The species information from GenBank was shown in Supplemental Table S8. The 13CPG dataset matrix included 150,415 nucleotide sites, of which 6259 were variable sites. The second data matrix, 70 g 50 s, contained 66 protein-coding genes and four rRNA genes from 50 Santalales species. After excluding ambiguous regions and sites, this dataset contained 56,789 nucleotide sites, of which 13,458 (23.70%) were parsimony-informative sites.
The 70 g 50 s dataset was analyzed under the Akaike Information Corrected Criterion (AICc) using strict hierarchical clustering analysis in PartitionFinder (lnL = −263,607.113888; AICc = 528,592.787194). The optimal partitioning scheme contained 57 partitions (Table 3). The ML tree under the unpartitioned and the three partitioned schemes produced identical topologies (Figure 5 and Supplemental Figures S3–S5). The ML tree inferred from the 13CPG and 70 g 50 s datasets were similar to the phylogenetic relationships of Santalum species (Figure 5).
According to the 70 g 50 s dataset, we inferred the phylogeny of Santalales. The ML tree showed that all the families were generally resolved and supported as monophyletic clades. According to the results of Chen et al. and Guo et al. [30,33], we selected Erythropalum scandens (Erythropalaceae) as the root of this tree. Ximeniaceae was the earliest diverged lineage. Loranthaceae and Schoepfiaceae formed a clade (BS = 100/PP = 1). Opiliaceae followed by Cervantesiacea were successive sisters to a clade comprising the remaining Santalales. Santalaceae was sister to Viscaceae plus Amphorogynaceae (BS = 100/PP = 1).
All Santalum species formed a monophyletic clade (BS = 100/PP = 1) and were sister to Osyris wightiana within Santalaceae. The phylogenetic relationships among the Santalum species based on the 70 g 50 s dataset and 13CPG dataset had a similar topology. The phylogeny of Santalum had a short branch on the phylogenetic tree, indicating low divergence among Santalum species. Santalum spicatum was the first diverged branch. Santalum acuminatum was sister to the remaining species which formed two lineages. The first lineage included three species (S. leptocladum, S. freycinetianum var. pyrularium, and S. sp.) and within the second lineage, two samples of S. album were sister to the remaining species, and the relationships of the three branches were not clear (70 g 50 s: BS = 48/BI = 0.53, 13CPG: BS = 49/BI = 0.72). The S. boninense from section Santalum was sister to S. paniculatum and S. ellipticum from the section Hawaiiensia (Figure 5). S. acuminatum and S. spicatum were in the formerly recognized the Australian section Eucarya.
3.6. The Estimated Divergence Time
Bayesian relaxed molecular clock analyses suggested that the crown age of the Santalales was 113.91 Mya (Figure 6). The split between the Santalaceae and its closest relatives, Viscaceae and Amphorogynaceae, occurred 81.07 Mya (95% HPD: 71.71–96.27 Mya). The mean crown ages of Santalaceae, Viscaceae, and Amphorogynaceae were 38.44, 47.87, and 6.18 Mya, respectively. The crown age of Santalum was 8.46 Mya (95% HPD: 3.8–14.06 Mya) in the later Miocene. The first divergence occurred around 6.97 Mya (95% HPD: 3.03–12 Mya), followed by independent branch-splitting events within the two lineages at 3.02 Mya (95% HPD: 1.41–4.95 Mya). Diversification within the two lineages occurred over a short period of time, approximately 1 Mya.
4. Discussion
4.1. Santalum Chloroplast Genome Evolution and Variation
Our findings revealed that the Santalum chloroplast genomes have highly similar genome structures, genome sizes, and gene contents (Figure 3 and Figure 4). Our findings are similar to other chloroplast genome studies reporting that single-copy regions and non-coding regions are more variable than IRs and coding regions [45,62]. The variation in size relative to other angiosperm species was mainly due to some missing genes (Figure 1).
All encoded NAD(P)H dehydrogenase complex (Ndh) genes in the Santalum chloroplast genome had functional or physical losses. The ndh genes were the earliest functional losses in the chloroplast genome of hemiparasites [31,63]. All the ndh genes have been lost in the Santalales hemiparasites [30,33], suggesting that the chloroplast NDH pathway is not essential in these lineages, or this function has been transferred to the nuclear genome [31,64]. Another degraded chloroplast gene in the Santalum chloroplast genome was infA; this mutation was detected in most Santalales hemiparasites. The infA gene is a translation initiation factor of the translation initiation complex. Loss and pseudogenization of infA has occurred in many hemiparasitic and holoparasitic plants [31,65]. This gene has also been independently lost multiple times among photoautotrophic plant lineages [66].
The non-synonymous (dN) and synonymous (dS) nucleotide substitution are indicators of the rates of evolution and natural selection. Selection pressure is another factor affecting the rate of sequence evolution. The ω has become a standard measure of selective pressure with ω = 1, >1, <1 signifying neutral evolution, positive selection, and negative or purifying selection [67]. The ω for the branches of Santalales estimated by CODEML under the branch model were less than 1. This indicated that the patterns of parasitic plant chloroplast genome variations were not consistent with strictly neutral molecular evolutions [48,68]. Purifying selection may be the predominant force shaping parasitic plants evolution. The Santalum clade had a lower ω (ω = 0.072) than other Santalales species (ω = 0.151), which means that Santalum may have been shaped by stronger purifying selection than other Santalales species.
The chloroplast genome is inherited as a linked unit, however, more evidence suggesting the strength of selection acting on each coding genes or gene groups were different [46,69]. The lower ω in most genes showed all species underwent a purifying selection (ω < 0.5). Five genes (rps3, rps7, ycf1, matK, and rpl33) in Santalum chloroplast genome have a higher ω value (Supplemental Table S6), of which three were ribosomal protein genes (rpl and rps). dN analyses also showed that these two gene groups have fast non-synonymous substitution rates (Figure 3), which were similar to those of photosynthesis plants [46,70]. matK and ycf1 were two highly divergent genes in the chloroplast genome and are frequently used in plant phylogeny and DNA barcoding (see below). The product of the matK gene is believed to act as a splicing factor for plastid group IIA introns [71] and the ycf1 gene is essential for protein translocons at inner envelope membranes [72]. Photosynthetic apparatus genes (psa, psb, pet) in Santalum chloroplast genome have the lowest dN rates and ω ratios (Figure 3), which were similar to the nonparasitic plants [73]. It was indicated that the photosynthetic apparatus-related genes in hemiparasitic Santalum were conservative.
Microstructural mutation events are ubiquitous in chloroplast genome evolution, but have been little studied. Indels and small inversions were analyzed in this study (Figure 4 and Table 2). Based on Dong et al. [51], we classified indels mutations into three categories: SSR-related indels, repeat-related indels, and normal indels. The normal indels were the most frequent in the Santalum chloroplast genome, and the size was also variable, ranging from 1 to 331 bp (Figure 4). Slipped strand mispairing (SSM) has been suggested as the mechanism leading to most SSR-related indels [74,75]. DNA recombination has also been proposed to cause repeat related indels [74,75]. These different mechanisms might be responsible for the observed differences in indel length.
Mutation hotspot regions in the chloroplast genome have been identified in most plant lineages, and studies have identified those markers were more variable than universal chloroplast markers [62,73,76,77]. We identified three variable regions (ccsA–trnL, ΨndhE–ΨndhG-rps15, and ycf1) by comparing the Santalum chloroplast genomes. The ycf1 gene has been identified to be highly variable in several lineages, such as Dalbergia [78], Diospyros [62], and Quercus [79]. Studies have shown that ycf1 is phylogenetically useful [80] and is associated with a high success rate for DNA barcoding [81]. ccsA–trnL and ΨndhE–ΨndhG-rps15 have been less widely used in the phylogeny and DNA barcoding.
4.2. Phylogenetic Relationships of Santalum
Based on morphological characters, such as the floral tube color, position of the ovary, the Santalum has been classified into five sections (Santalum, Solenantha, Hawaiiensia, Polynesica, and Eucarya) [3,4]. Section Santalum was described as usually having reddish corollas that were longer than they were wide and partly superior ovaries [3,4], and most species were located in Australia and New Caledonia. The section Santalum included eight species and two varieties. According to the chloroplast genome data (Figure 5) and the ITS and ETS data [2,14], these species were at multiple phylogenetic positions in the tree and did not form a monophyletic group. All the datasets supported that S. yasi was closer to S. album. The four species on the Hawaiian Islands were separated into two sections (Solenantha and Hawaiiensia). Section Solenantha was described as having longer perianth tubes, smaller ovaries, and the absence of hair proximal to the filaments. Section Hawaiiensia was delimited based on their white, green, brown, or orange corollas and inferior ovaries [3,4]. Based on the such morphological characters, Skottsberg [82] inferred that these two sections were closely related and Fosberg and Sachét [83] treated section Polynesica as a synonym of section Hawaiiensia. However, molecular phylogenetic results demonstrated that sections Hawaiiensia and Solenantha formed monophyletic groups, but were not closely related. Moreover, sections Hawaiiensia and Polynesica were more closely related to other taxa of Santalum [14]. Two species and eight varieties were included in section Polynesica, which was described as appearing to be similar to Hawaiiensia but with ovaries that were partly superior. In the results of molecular phylogenetic analyses, all the varieties of S. insulare formed a monophyletic group, Santalum fernandezianum, which is located on the Juan Fernandez Islands, and is extinct, thus its position in Santalum cannot be determined. The fifth section, Eucarya, is located in Australia, and includes three species [14]. Both chloroplast genome data and nuclear data (ITS and ETS) supported this section as the earliest diverged lineage of the genus. However, these three species did not form a monophyletic group (Figure 5) [2].
Compared the results of phylogenetic analyses based on the chloroplast genome and the nuclear data, there were some incongruences. The ITS, ETS, and GBSSI (granule-bound starch synthase) sequences (nuclear data) supported the notion that S. acuminatum and S. spicatum formed a monophyletic group [2,5], which conflicted with the chloroplast genome results (Figure 5). Santalum ellipticum and S. ellipticum var. littorale did not form a monophyletic group and were closed to S. paniculatum (Figure 5). This was discordant with the ITS and ETS results [14]. There have been ancient hybridization events in Santalum species, which might account for this discordance [13,84,85]. Polyploidy was one of the reasons for the gene tree conflicts [86,87].
There were several auto- and allopolyploid species in Santalum according to an estimate from measuring the C value [5]. Chloroplast genome data showed the maternal line of the allopolyploid species and were used to identify the maternal progenitor. The allopolyploid species of S. ellipticum, S. paniculatum, and S. boninense formed a clade, and there were no diploid species in this clade, although the maternal parents were unresolved. The progenitors might be extinct or not yet discovered. The biogeography suggests that Santalum island colonists tend to be polyploids [5].
Using five fossils, our results showed that the stem time of Santalum was 38.44 Mya, the crown time was 8.46 Mya, most of lineages appeared no later than 2.16−6.97 Mya and radiated less than 1 Mya (Figure 6). These results indicated that the Santalum underwent rapid, recent radiation in about 2 Mya, which was consistent with dispersal and isolation on islands (Figure 6). Santalum species exhibit island distribution types. Biogeographic reconstructions indicated the Santalum originated in Australia and went through long-distance dispersal out of Australia [2]. Divergence time results indicated the time of speciation events was less than the time of island formation, which means there were multiple long-distance dispersal between Pacific Islands.
5. Conclusions
The analyzed Santalum chloroplast genomes have a similar structure, gene number, and gene order. Mutation hotspots regions, small inversions, and the co-occurrence of different types of indels or single nucleotide polymorphisms were identified, and the whole set of ndh genes and the infA gene were found to lose their functions. The phylogenetic and divergence analysis based on the complete chloroplast genome discovered that the Santalum species were originated by radiation evolution, and most speciation events occurred less than 1 Mya.
Supplementary Materials
The following are available online at https://www.mdpi.com/article/10.3390/f12101303/s1, Figure S1. Chloroplast genome map of Santalum. Genes shown inside circle are transcribed counterclockwise, gene outside are transcribed clockwise. Different functional groups of genes are showed in different colors. Figure S2. Gel profiles of fragments amplified from two samples using four pairs of primers; Figure S3. ML tree with GTR + G model using 70 g 50 s dataset. ML bootstrap support values were presented at each node. ML = 100 were not presented; Figure S4. ML tree with genes partitioning scheme using 70 g 50 s dataset. ML bootstrap support values were presented at each node. ML = 100 were not presented; Figure S5. ML tree with rcluster partitioning scheme using 70 g 50 s dataset. ML bootstrap support values were presented at each node. ML = 100 were not presented. Table S1. The list of species and varieties in Santalum. Table S2. Sampling information for this study; Table S3. Numbers of nucleotide substitutions and sequence genetic distance in 11 Santalum species complete chloroplast genomes. The upper triangle indicates the number of nucleotide substitutions, and the lower triangle indicates the number of sequence distances in complete chloroplast genomes; Table S4. Variability of the three highly mutation hotspot regions and the universal chloroplast DNA barcodes in Santalum; Table S5. Primers of the three highly mutation hotspot regions; Table S6. Average values of dS, dN, and dN/dS ratios among genes and gene groups; Table S7. The chloroplast genomic location and length distributions of 14 inversions of Santalum; Table S8. A list of the 38 taxa sampled from GenBank for phylogenetic analysis.
Author Contributions
Conceptualization, X.L., D.X. and Z.H.; methodology, X.L., D.X. and Z.H.; investigation, X.L., Z.H., N.Z. and Z.C.; resources, X.L., Z.H., N.Z. and Z.C.; writing—original draft preparation, X.L.; writing—review and editing, X.L.; supervision, D.X.; All authors have read and agreed to the published version of the manuscript.
Funding
This research was funded by the Fundamental Research Funds for the Central Non-profit Research Institution of Chinese Academy of Forestry, grant number CAFYBB2019QB003, CAFYBB2016QB010, the National Natural Science Foundation of China, grant number 31500512) and the National Key Research and Development Program of China, grant number 2016YFD060060503.
Institutional Review Board Statement
Not applicable.
Informed Consent Statement
Not applicable.
Data Availability Statement
The 12 newly assembled chloroplast genomes were deposited in GenBank under the accession numbers of MW464914 to MW464925.
Conflicts of Interest
The authors declare no conflict of interest.
References
- Merlin, M.; VanRavenswaay, D. The History of human impact on the genus Santalum in Hawai’i. In Proceedings of the Symposium on Sandalwood in the Pacific, Honolulu, HI, USA, 9–11 April 1990; General Technical Report PSW-GTR-122. Lawrence, H., Conrad, C.E., Eds.; Pacific Southwest Research Station, Forest Service: Berkeley, CA, USA; US Department of Agriculture: Washington, DC, USA, 1990; pp. 46–60. [Google Scholar]
- Harbaugh, D.T.; Baldwin, B.G. Phylogeny and biogeography of the sandalwoods (Santalum, Santalaceae): Repeated dispersals throughout the Pacific. Am. J. Bot. 2007, 94, 1028–1040. [Google Scholar] [CrossRef]
- Stemmermann, L. Observations on the genus Santalum (Santalaceae) in Hawaii. Pac. Sci. 1980, 34, 41–53. [Google Scholar]
- Wagner, W.L.; Herbst, D.R.; Sohmer, S.H. Manual of the Flowering Plants of Hawai’i; University of Hawai’i Press: Honolulu, HI, USA, 1999. [Google Scholar]
- Harbaugh, D.T. Polyploid and Hybrid Origins of Pacific Island Sandalwoods (Santalum, Santalaceae) Inferred from Low-Copy Nuclear and Flow Cytometry Data. Int. J. Plant Sci. 2008, 169, 677–685. [Google Scholar] [CrossRef]
- Stuessy, T.F.; Marticorena, C.; Rodriguez R, R.; Crawford, D.J.; Silva O, M. Endemism in the vascular flora of the Juan Fernández Islands. Aliso J. Syst. Evol. Bot. 1992, 13, 297–307. [Google Scholar] [CrossRef] [Green Version]
- Butaud, J.-F.; Rives, F.; Verhaegen, D.; Bouvet, J.-M. Phylogeography of Eastern Polynesian sandalwood (Santalum insulare), an endangered tree species from the Pacific: A study based on chloroplast microsatellites. J. Biogeogr. 2005, 32, 1763–1774. [Google Scholar] [CrossRef]
- Maina, S.L.; Pray, L.A.; DeFilipps, R.A. A historical note on the endangered Santalum boninensis (Santalaceae) of the Ogasawara Islands: Early reports by Takasi Tuyama. Atoll Res. Bull. 1988, 319, 19–24. [Google Scholar]
- Waldren, S.; Florence, J.; Chepstow-Lusty, A. Rare and endemic vascular plants of the Pitcairn Islands, south-central Pacific Ocean: A conservation appraisal. Biol. Conserv. 1995, 74, 83–98. [Google Scholar] [CrossRef]
- Hewson, H.; George, A. Santalaceae. In Flora of Australia; Australian Government Publishing Service: Canberra, Australia, 1984; Volume 22, pp. 29–67. [Google Scholar]
- Tuyama, T. On Santalum boninense, and the distribution of the species of Santalum. J. Jpn. Bot. 1939, 15, 697–712. [Google Scholar]
- St. John, H. Revision of the Hawaiian species of Santalum (Santalaceae): Hawaiian plant studies. Phytologia 1984, 55, 217–226. [Google Scholar]
- Harbaugh, D.T.; Oppenheimer, H.L.; Wood, K.R.; Wagner, W.L. Taxonomic Revision of the Endangered Hawaiian Red-flowered Sandalwoods (Santalum) and Discovery of an Ancient Hybrid Species. Syst. Bot. 2010, 35, 827–838. [Google Scholar] [CrossRef] [Green Version]
- Harbaugh, D.T. A taxonomic revision of Australian northern sandalwood (Santalum lanceolatum, Santalaceae). Aust. Syst. Bot. 2007, 20, 409–416. [Google Scholar] [CrossRef]
- Lichao, J.; Tuo, H.; Eleanor, E.D.; Yonggang, Z.; Andrew, J.L.; Yafang, Y. Applicability of chloroplast DNA barcodes for wood identification between Santalum album and its adulterants. Holzforschung 2019, 73, 209–218. [Google Scholar] [CrossRef]
- Lloyd Evans, D.; Joshi, S.V.; Wang, J. Whole chloroplast genome and gene locus phylogenies reveal the taxonomic placement and relationship of Tripidium (Panicoideae: Andropogoneae) to sugarcane. BMC Evol. Biol. 2019, 19, 33. [Google Scholar] [CrossRef] [Green Version]
- Zhao, D.-N.; Ren, Y.; Zhang, J.-Q. Conservation and innovation: Plastome evolution during rapid radiation of Rhodiola on the Qinghai-Tibetan Plateau. Mol. Phylogenet. Evol. 2019, 144, 106713. [Google Scholar] [CrossRef] [PubMed]
- Duan, L.; Harris, A.J.; Su, C.; Zhang, Z.-R.; Arslan, E.; Ertuğrul, K.; Loc, P.K.; Hayashi, H.; Wen, J.; Chen, H.-F. Chloroplast Phylogenomics Reveals the Intercontinental Biogeographic History of the Liquorice Genus (Leguminosae: Glycyrrhiza). Front. Plant Sci. 2020, 11, 793. [Google Scholar] [CrossRef] [PubMed]
- Dong, W.; Xu, C.; Wu, P.; Cheng, T.; Yu, J.; Zhou, S.; Hong, D.-Y. Resolving the systematic positions of enigmatic taxa: Manipulating the chloroplast genome data of Saxifragales. Mol. Phylogenet. Evol. 2018, 126, 321–330. [Google Scholar] [CrossRef] [PubMed]
- Abdullah; Mehmood, F.; Shahzadi, I.; Ali, Z.; Islam, M.; Naeem, M.; Mirza, B.; Lockhart, P.J.; Ahmed, I.; Waheed, M.T. Correlations among oligonucleotide repeats, nucleotide substitutions, and insertion–deletion mutations in chloroplast genomes of plant family Malvaceae. J. Syst. Evol. 2021, 59, 388–402. [Google Scholar] [CrossRef]
- Wikström, N.; Bremer, B.; Rydin, C. Conflicting phylogenetic signals in genomic data of the coffee family (Rubiaceae). J. Syst. Evol. 2020, 58, 440–460. [Google Scholar] [CrossRef]
- Sloan, D.B.; Triant, D.A.; Forrester, N.; Bergner, L.M.; Wu, M.; Taylor, D.R. A recurring syndrome of accelerated plastid genome evolution in the angiosperm tribe Sileneae (Caryophyllaceae). Mol. Phylogenet. Evol. 2014, 72, 82–89. [Google Scholar] [CrossRef]
- Dong, W.; Liu, Y.; Xu, C.; Gao, Y.; Yuan, Q.; Suo, Z.; Zhang, Z.; Sun, J. Chloroplast phylogenomic insights into the evolution of Distylium (Hamamelidaceae). BMC Genom. 2021, 22, 1–12. [Google Scholar] [CrossRef]
- Dong, W.; Sun, J.; Liu, Y.; Xu, C.; Wang, Y.; Suo, Z.; Zhou, S.; Zhang, Z.; Wen, J. Phylogenomic relationships and species identification of the olive genus Olea (Oleaceae). J. Syst. Evol. 2021. [Google Scholar] [CrossRef]
- Mohamoud, Y.A.; Mathew, L.S.; Torres, M.F.; Younuskunju, S.; Krueger, R.; Suhre, K.; Malek, J.A. Novel subpopulations in date palm (Phoenix dactylifera) identified by population-wide organellar genome sequencing. BMC Genom. 2019, 20, 1–7. [Google Scholar] [CrossRef] [PubMed] [Green Version]
- Qiao, J.; Zhang, X.; Chen, B.; Huang, F.; Xu, K.; Huang, Q.; Huang, Y.; Hu, Q.; Wu, X. Comparison of the cytoplastic genomes by resequencing: Insights into the genetic diversity and the phylogeny of the agriculturally important genus Brassica. BMC Genom. 2020, 21, 1–15. [Google Scholar] [CrossRef] [PubMed]
- Dong, W.; Xu, C.; Liu, Y.; Shi, J.; Li, W.; Suo, Z. Chloroplast phylogenomics and divergence times of Lagerstroemia (Lythraceae). BMC Genom. 2021, 22, 1–13. [Google Scholar] [CrossRef] [PubMed]
- Li, Y.; Zhou, J.-G.; Chen, X.-L.; Cui, Y.-X.; Xu, Z.-C.; Li, Y.-H.; Song, J.-Y.; Duan, B.-Z.; Yao, H. Gene losses and partial deletion of small single-copy regions of the chloroplast genomes of two hemiparasitic Taxillus species. Sci. Rep. 2017, 7, 12834. [Google Scholar] [CrossRef] [PubMed]
- Liu, B.; Le, C.T.; Barrett, R.L.; Nickrent, D.L.; Chen, Z.; Lu, L.; Vidal-Russell, R. Historical biogeography of Loranthaceae (Santalales): Diversification agrees with emergence of tropical forests and radiation of songbirds. Mol. Phylogenet. Evol. 2018, 124, 199–212. [Google Scholar] [CrossRef] [PubMed] [Green Version]
- Chen, X.; Fang, D.; Wu, C.; Liu, B.; Liu, Y.; Sahu, S.K.; Song, B.; Yang, S.; Yang, T.; Wei, J.; et al. Comparative Plastome Analysis of Root- and Stem-Feeding Parasites of Santalales Untangle the Footprints of Feeding Mode and Lifestyle Transitions. Genome Biol. Evol. 2020, 12, 3663–3676. [Google Scholar] [CrossRef] [Green Version]
- Krause, K. Piecing together the puzzle of parasitic plant plastome evolution. Planta 2011, 234, 647–656. [Google Scholar] [CrossRef]
- Molina, J.; Hazzouri, K.M.; Nickrent, D.; Geisler, M.; Meyer, R.S.; Pentony, M.M.; Flowers, J.M.; Pelser, P.; Barcelona, J.; Inovejas, S.A.; et al. Possible Loss of the Chloroplast Genome in the Parasitic Flowering Plant Rafflesia lagascae (Rafflesiaceae). Mol. Biol. Evol. 2014, 31, 793–803. [Google Scholar] [CrossRef] [Green Version]
- Guo, X.; Liu, C.; Zhang, G.; Su, W.; Landis, J.B.; Zhang, X.; Wang, H.; Ji, Y. The Complete Plastomes of Five Hemiparasitic Plants (Osyris wightiana, Pyrularia edulis, Santalum album, Viscum liquidambaricolum, and V. ovalifolium): Comparative and Evolutionary Analyses Within Santalales. Front. Genet. 2020, 11, 597. [Google Scholar] [CrossRef]
- Li, J.; Wang, S.; Jing, Y.; Wang, L.; Zhou, S. A modified CTAB protocol for plant DNA extraction. Chin. Bull. Bot. 2013, 48, 72–78. [Google Scholar]
- Bolger, A.M.; Lohse, M.; Usadel, B. Trimmomatic: A flexible trimmer for Illumina sequence data. Bioinformatics 2014, 30, 2114–2120. [Google Scholar] [CrossRef] [PubMed] [Green Version]
- Jin, J.-J.; Yu, W.-B.; Yang, J.-B.; Song, Y.; Depamphilis, C.W.; Yi, T.-S.; Li, D.-Z. GetOrganelle: A fast and versatile toolkit for accurate de novo assembly of organelle genomes. Genome Biol. 2020, 21, 1–31. [Google Scholar] [CrossRef] [PubMed]
- Chen, Z.; Zhao, N.; Li, S.; Grover, C.E.; Nie, H.; Wendel, J.F.; Hua, J. Plant Mitochondrial Genome Evolution and Cytoplasmic Male Sterility. Crit. Rev. Plant Sci. 2017, 36, 55–69. [Google Scholar] [CrossRef]
- Kan, S.-L.; Shen, T.-T.; Gong, P.; Ran, J.-H.; Wang, X.-Q. The complete mitochondrial genome of Taxus cuspidata (Taxaceae): Eight protein-coding genes have transferred to the nuclear genome. BMC Evol. Biol. 2020, 20, 1–17. [Google Scholar] [CrossRef] [PubMed] [Green Version]
- Huang, D.I.; Cronk, Q. Plann: A Command-Line Application for Annotating Plastome Sequences. Appl. Plant Sci. 2015, 3, 1500026. [Google Scholar] [CrossRef] [Green Version]
- Greiner, S.; Lehwark, P.; Bock, R. OrganellarGenomeDRAW (OGDRAW) version 1.3.1: Expanded toolkit for the graphical visualization of organellar genomes. Nucleic Acids Res. 2019, 47, W59–W64. [Google Scholar] [CrossRef] [Green Version]
- Frazer, K.; Pachter, L.; Poliakov, A.; Rubin, E.M.; Dubchak, I. VISTA: Computational tools for comparative genomics. Nucleic Acids Res. 2004, 32, W273–W279. [Google Scholar] [CrossRef]
- Katoh, K.; Standley, D.M. MAFFT multiple sequence alignment software version 7: Improvements in performance and usability. Mol. Biol. Evol. 2013, 30, 772–780. [Google Scholar] [CrossRef] [Green Version]
- Kumar, S.; Stecher, G.; Li, M.; Knyaz, C.; Tamura, K.; Battistuzzi, F.U. MEGA X: Molecular Evolutionary Genetics Analysis across Computing Platforms. Mol. Biol. Evol. 2018, 35, 1547–1549. [Google Scholar] [CrossRef]
- Rozas, J.; Ferrer-Mata, A.; Sánchez-DelBarrio, J.C.; Guirao-Rico, S.; Librado, P.; Ramos-Onsins, S.; Sánchez-Gracia, A. DnaSP 6: DNA Sequence Polymorphism Analysis of Large Data Sets. Mol. Biol. Evol. 2017, 34, 3299–3302. [Google Scholar] [CrossRef] [PubMed]
- Dong, W.; Xu, C.; Cheng, T.; Lin, K.; Zhou, S. Sequencing Angiosperm Plastid Genomes Made Easy: A Complete Set of Universal Primers and a Case Study on the Phylogeny of Saxifragales. Genome Biol. Evol. 2013, 5, 989–997. [Google Scholar] [CrossRef] [PubMed] [Green Version]
- Dong, W.; Xu, C.; Cheng, T.; Zhou, S. Complete Chloroplast Genome of Sedum sarmentosum and Chloroplast Genome Evolution in Saxifragales. PLoS ONE 2013, 8, e77965. [Google Scholar] [CrossRef] [Green Version]
- Chang, C.-C.; Lin, H.-C.; Lin, I.-P.; Chow, T.-Y.; Chen, H.-H.; Chen, W.-H.; Cheng, C.-H.; Lin, C.-Y.; Liu, S.-M.; Chang, C.-C.; et al. The Chloroplast Genome of Phalaenopsis aphrodite (Orchidaceae): Comparative Analysis of Evolutionary Rate with that of Grasses and Its Phylogenetic Implications. Mol. Biol. Evol. 2005, 23, 279–291. [Google Scholar] [CrossRef] [Green Version]
- Petersen, G.; Cuenca, A.; Seberg, O. Plastome Evolution in Hemiparasitic Mistletoes. Genome Biol. Evol. 2015, 7, 2520–2532. [Google Scholar] [CrossRef] [PubMed] [Green Version]
- Gao, F.; Chen, C.; Arab, D.A.; Du, Z.; He, Y.; Ho, S.Y.W. EasyCodeML: A visual tool for analysis of selection using CodeML. Ecol. Evol. 2019, 9, 3891–3898. [Google Scholar] [CrossRef] [PubMed] [Green Version]
- Yang, Z. PAML 4: Phylogenetic Analysis by Maximum Likelihood. Mol. Biol. Evol. 2007, 24, 1586–1591. [Google Scholar] [CrossRef] [Green Version]
- Dong, W.; Xu, C.; Wen, J.; Zhou, S. Evolutionary directions of single nucleotide substitutions and structural mutations in the chloroplast genomes of the family Calycanthaceae. BMC Evol. Biol. 2020, 20, 96. [Google Scholar] [CrossRef] [PubMed]
- Kalyaanamoorthy, S.; Minh, B.Q.; Wong, T.; Von Haeseler, A.; Jermiin, L.S. ModelFinder: Fast model selection for accurate phylogenetic estimates. Nat. Methods 2017, 14, 587–589. [Google Scholar] [CrossRef] [Green Version]
- Lanfear, R.; Frandsen, P.; Wright, A.M.; Senfeld, T.; Calcott, B. PartitionFinder 2: New Methods for Selecting Partitioned Models of Evolution for Molecular and Morphological Phylogenetic Analyses. Mol. Biol. Evol. 2016, 34, 772–773. [Google Scholar] [CrossRef] [Green Version]
- Kozlov, A.M.; Darriba, D.; Flouri, T.; Morel, B.; Stamatakis, A. RAxML-NG: A fast, scalable and user-friendly tool for maximum likelihood phylogenetic inference. Bioinformatics 2019, 35, 4453–4455. [Google Scholar] [CrossRef] [Green Version]
- Ronquist, F.; Teslenko, M.; Van Der Mark, P.; Ayres, D.L.; Darling, A.; Hoehna, S.; Larget, B.; Liu, L.; Suchard, M.A.; Huelsenbeck, J.P. MrBayes 3.2: Efficient Bayesian Phylogenetic Inference and Model Choice Across a Large Model Space. Syst. Biol. 2012, 61, 539–542. [Google Scholar] [CrossRef] [PubMed] [Green Version]
- Rambaut, A.; Suchard, M.; Xie, D.; Drummond, A. Tracer V1. 6. 2014. Available online: http://beast.bio.ed.ac.uk/Tracer (accessed on 30 August 2021).
- Wikström, N.; Savolainen, V.; Chase, M.W. Evolution of the angiosperms: Calibrating the family tree. Proc. R. Soc. Lond. Ser. B Biol. Sci. 2001, 268, 2211–2220. [Google Scholar] [CrossRef] [PubMed]
- Mildenhall, D.C. Cranwellia costatan.sp. andPodosporites erugatusn.sp. from middle Pliocene (? early Pleistocene) sediments, South Island, New Zealand. J. R. Soc. N. Z. 1978, 8, 253–274. [Google Scholar] [CrossRef] [Green Version]
- Mildenhall, D. New Zealand late Cretaceous and cenozoic plant biogeography: A contribution. Palaeogeogr. Palaeoclimatol. Palaeoecol. 1980, 31, 197–233. [Google Scholar] [CrossRef]
- Vidal-Russell, R.; Nickrent, D.L. The first mistletoes: Origins of aerial parasitism in Santalales. Mol. Phylogenet. Evol. 2008, 47, 523–537. [Google Scholar] [CrossRef]
- Bouckaert, R.; Heled, J.; Kühnert, D.; Vaughan, T.; Wu, C.-H.; Xie, D.; Suchard, M.A.; Rambaut, A.; Drummond, A.J. BEAST 2: A Software Platform for Bayesian Evolutionary Analysis. PLoS Comput. Biol. 2014, 10, e1003537. [Google Scholar] [CrossRef] [Green Version]
- Li, W.; Liu, Y.; Yang, Y.; Xie, X.; Lu, Y.; Yang, Z.; Jin, X.; Dong, W.; Suo, Z. Interspecific chloroplast genome sequence diversity and genomic resources in Diospyros. BMC Plant Biol. 2018, 18, 210. [Google Scholar] [CrossRef]
- Wickett, N.J.; Zhang, Y.; Hansen, S.K.; Roper, J.M.; Kuehl, J.V.; Plock, S.A.; Wolf, P.G.; Depamphilis, C.W.; Boore, J.L.; Goffinet, B. Functional Gene Losses Occur with Minimal Size Reduction in the Plastid Genome of the Parasitic Liverwort Aneura mirabilis. Mol. Biol. Evol. 2008, 25, 393–401. [Google Scholar] [CrossRef] [Green Version]
- Lin, C.S.; Chen, J.J.; Chiu, C.C.; Hsiao, H.C.; Yang, C.J.; Jin, X.H.; Leebens-Mack, J.; de Pamphilis, C.W.; Huang, Y.T.; Yang, L.H. Concomitant loss of NDH complex-related genes within chloroplast and nuclear genomes in some orchids. Plant J. 2017, 90, 994–1006. [Google Scholar] [CrossRef] [Green Version]
- Roquet, C.; Coissac, É.; Cruaud, C.; Boleda, M.; Boyer, F.; Alberti, A.; Gielly, L.; Taberlet, P.; Thuiller, W.; Van Es, J.; et al. Understanding the evolution of holoparasitic plants: The complete plastid genome of the holoparasite Cytinus hypocistis (Cytinaceae). Ann. Bot. 2016, 118, 885–896. [Google Scholar] [CrossRef] [Green Version]
- Millen, R.S.; Olmstead, R.G.; Adams, K.L.; Palmer, J.D.; Lao, N.T.; Heggie, L.; Kavanagh, T.A.; Hibberd, J.M.; Gray, J.C.; Morden, C.W.; et al. Many parallel losses of infA from chloroplast DNA during angiosperm evolution with multiple independent transfers to the nucleus. Plant Cell 2001, 13, 645–658. [Google Scholar] [CrossRef] [PubMed] [Green Version]
- Yang, Z.; Nielsen, R. Estimating Synonymous and Nonsynonymous Substitution Rates Under Realistic Evolutionary Models. Mol. Biol. Evol. 2000, 17, 32–43. [Google Scholar] [CrossRef] [Green Version]
- Wicke, S.; Müller, K.F.; Depamphilis, C.W.; Quandt, D.; Bellot, S.; Schneeweiss, G.M. Mechanistic model of evolutionary rate variation en route to a nonphotosynthetic lifestyle in plants. Proc. Natl. Acad. Sci. USA 2016, 113, 9045–9050. [Google Scholar] [CrossRef] [PubMed] [Green Version]
- Wicke, S.; Schäferhoff, B.; Depamphilis, C.W.; Müller, K.F. Disproportional Plastome-Wide Increase of Substitution Rates and Relaxed Purifying Selection in Genes of Carnivorous Lentibulariaceae. Mol. Biol. Evol. 2013, 31, 529–545. [Google Scholar] [CrossRef] [Green Version]
- Guisinger, M.M.; Kuehl, J.N.V.; Boore, J.L.; Jansen, R.K. Genome-wide analyses of Geraniaceae plastid DNA reveal unprecedented patterns of increased nucleotide substitutions. Proc. Nat. Acad. Sci. USA 2008, 105, 18424–18429. [Google Scholar] [CrossRef] [PubMed] [Green Version]
- Wicke, S.; Schneeweiss, G.M.; Depamphilis, C.W.; Müller, K.F.; Quandt, D. The evolution of the plastid chromosome in land plants: Gene content, gene order, gene function. Plant Mol. Biol. 2011, 76, 273–297. [Google Scholar] [CrossRef] [PubMed] [Green Version]
- Kikuchi, S.; Bédard, J.; Hirano, M.; Hirabayashi, Y.; Oishi, M.; Imai, M.; Takase, M.; Ide, T.; Nakai, M. Uncovering the Protein Translocon at the Chloroplast Inner Envelope Membrane. Science 2013, 339, 571–574. [Google Scholar] [CrossRef]
- Wu, Z.; Liao, R.; Yang, T.; Dong, X.; Lan, D.; Qin, R.; Liu, H. Analysis of six chloroplast genomes provides insight into the evolution of Chrysosplenium (Saxifragaceae). BMC Genom. 2020, 21, 1–14. [Google Scholar] [CrossRef] [PubMed]
- Li, Y.-C.; Korol, A.B.; Fahima, T.; Beiles, A.; Nevo, E. Microsatellites: Genomic distribution, putative functions and mutational mechanisms: A review. Mol. Ecol. 2002, 11, 2453–2465. [Google Scholar] [CrossRef]
- Kelchner, S.A. The Evolution of Non-Coding Chloroplast DNA and Its Application in Plant Systematics. Ann. Mo. Bot. Gard. 2000, 87, 482. [Google Scholar] [CrossRef]
- Han, T.; Li, M.; Li, J.; Lv, H.; Ren, B.; Chen, J.; Li, W. Comparison of chloroplast genomes of Gynura species: Sequence variation, genome rearrangement and divergence studies. BMC Genom. 2019, 20, 1–10. [Google Scholar] [CrossRef] [PubMed] [Green Version]
- Ren, T.; Li, Z.-X.; Xie, D.-F.; Gui, L.-J.; Peng, C.; Wen, J.; He, X.-J. Plastomes of eight Ligusticum species: Characterization, genome evolution, and phylogenetic relationships. BMC Plant Biol. 2020, 20, 1–14. [Google Scholar] [CrossRef] [PubMed]
- Song, Y.; Zhang, Y.; Xu, J.; Li, W.; Li, M. Characterization of the complete chloroplast genome sequence of Dalbergia species and its phylogenetic implications. Sci. Rep. 2019, 9, 20401. [Google Scholar] [CrossRef]
- Pang, X.; Liu, H.; Wu, S.; Yuan, Y.; Li, H.; Dong, J.; Liu, Z.; An, C.; Su, Z.; Li, B. Species Identification of Oaks (Quercus L., Fagaceae) from Gene to Genome. Int. J. Mol. Sci. 2019, 20, 5940. [Google Scholar] [CrossRef] [Green Version]
- Dastpak, A.; Osaloo, S.K.; Maassoumi, A.A.; Safar, K.N. Molecular Phylogeny of Astragalussect. Ammodendron (Fabaceae) Inferred from Chloroplast ycf1 Gene. Ann. Bot. Fenn. 2018, 55, 75–82. [Google Scholar] [CrossRef]
- Dong, W.; Xu, C.; Li, C.; Sun, J.; Zuo, Y.; Shi, S.; Cheng, T.; Guo, J.; Zhou, S. ycf1, the most promising plastid DNA barcode of land plants. Sci. Rep. 2015, 5, 8348. [Google Scholar] [CrossRef] [Green Version]
- Skottsberg, C. The geographical distribution of the sandalwoods and its significance. In Proceedings of the Fourth Pacific Science Congress (Java), Honolulu, HI, USA, 9–11 April 1930; pp. 435–442. [Google Scholar]
- Fosberg, F.R.; Sachét, M.-H. Santalum in eastern Polynesia. Candollea 1985, 40, 459–470. [Google Scholar]
- Lee-Yaw, J.A.; Grassa, C.; Joly, S.; Andrew, R.; Rieseberg, L. An evaluation of alternative explanations for widespread cytonuclear discordance in annual sunflowers (Helianthus). New Phytol. 2019, 221, 515–526. [Google Scholar] [CrossRef] [Green Version]
- Wang, M.; Zhang, L.; Zhang, Z.; Li, M.; Wang, D.; Zhang, X.; Xi, Z.; Keefover-Ring, K.; Smart, L.; DiFazio, S.P.; et al. Phylogenomics of the genus Populus reveals extensive interspecific gene flow and balancing selection. New Phytol. 2020, 225, 1370–1382. [Google Scholar] [CrossRef]
- Morales-Briones, D.F.; Liston, A.; Tank, D.C. Phylogenomic analyses reveal a deep history of hybridization and polyploidy in the Neotropical genus Lachemilla (Rosaceae). New Phytol. 2018, 218, 1668–1684. [Google Scholar] [CrossRef] [PubMed] [Green Version]
- Yang, Y.; Moore, M.J.; Brockington, S.F.; Mikenas, J.; Olivieri, J.; Walker, J.F.; Smith, S.A. Improved transcriptome sampling pinpoints 26 ancient and more recent polyploidy events in Caryophyllales, including two allopolyploidy events. New Phytol. 2018, 217, 855–870. [Google Scholar] [CrossRef] [Green Version]
Figure 1.
Visualization of genome alignment of the Santalum chloroplast genomes using S. leptocladum as a reference using mVISTA. The y-axis shows the coordinates between the chloroplast genomes.
Figure 1.
Visualization of genome alignment of the Santalum chloroplast genomes using S. leptocladum as a reference using mVISTA. The y-axis shows the coordinates between the chloroplast genomes.

Figure 2.
Sliding window test of nucleotide diversity (π) in the Santalum chloroplast genomes. The three mutation hotspot regions (π > 0.012) were annotated. The window size was set to 800 bp and the sliding windows size was 100 bp. X-axis, position of the midpoint of a window; Y-axis, π values of each window.

Figure 3.
The dN, dS, and dN/dS values in Santalum gene groups.

Figure 4.
Number and size of indels in the Santalum chloroplast genomes. (a) Non-repeat indels; (b) repeat indels.
Figure 4.
Number and size of indels in the Santalum chloroplast genomes. (a) Non-repeat indels; (b) repeat indels.

Figure 5.
Phylogenetic trees of Santalales. (a) ML tree with strict hierarchical clustering partitioning scheme using 70 g 50 s dataset. ML bootstrap support value/Bayesian posterior probability were presented at each node. (b) ML tree with GTR+G model using 13CPG dataset. ML bootstrap support value/Bayesian posterior probability were presented at each node. ML = 100/BI = 1.0 were not presented.

Figure 6.
Divergence times of Santalales obtained from BEAST analysis based on 70 g 50 s dataset. Mean divergence time of the nodes were shown next to the nodes while the blue bars correspond to the 95% highest posterior density (HPD). Black circles indicate the five calibration points.
Figure 6.
Divergence times of Santalales obtained from BEAST analysis based on 70 g 50 s dataset. Mean divergence time of the nodes were shown next to the nodes while the blue bars correspond to the 95% highest posterior density (HPD). Black circles indicate the five calibration points.


Table 1.
Characteristics of newly sequenced Santalum chloroplast genomes.
| Species | Nucleotide Length (bp) | Number of Genes | GenBank Accession Number | ||||||
|---|---|---|---|---|---|---|---|---|---|
| Total | LSC | IR | SSC | Protein | tRNA | rRNA | Total | ||
| S. acuminatum | 143,291 | 82,944 | 24,484 | 11,379 | 67 | 30 | 4 | 101 | MW464925 |
| S. album-1 | 144,034 | 83,793 | 24,488 | 11,265 | 67 | 30 | 4 | 101 | MW464915 |
| S. album-2 | 144,101 | 83,802 | 24,511 | 11,277 | 67 | 30 | 4 | 101 | MW464922 |
| S. boninense | 144,263 | 83,912 | 24,501 | 11,349 | 67 | 30 | 4 | 101 | MW464916 |
| S. ellipticum | 144,250 | 83,911 | 24,495 | 11,349 | 67 | 30 | 4 | 101 | MW464917 |
| S. ellipticum var. littorale | 144,255 | 83,911 | 24,498 | 11,348 | 67 | 30 | 4 | 101 | MW464920 |
| S. freycinetianum var. pyrularium | 143,895 | 83,582 | 24,481 | 11,351 | 67 | 30 | 4 | 101 | MW464921 |
| S.leptocladum | 143,801 | 83,576 | 24,494 | 11,237 | 67 | 30 | 4 | 101 | MW464918 |
| S. sp. | 143,923 | 83,603 | 24,489 | 11,342 | 67 | 30 | 4 | 101 | MW464919 |
| S. paniculatum | 144,239 | 83,942 | 24,477 | 11,343 | 67 | 30 | 4 | 101 | MW464914 |
| S. spicatum | 143,638 | 83,314 | 24,495 | 11,334 | 67 | 30 | 4 | 101 | MW464924 |
| S. yasi | 144,019 | 83,736 | 24,497 | 11,289 | 67 | 30 | 4 | 101 | MW464923 |
Table 2.
Sequence divergence of Santalum chloroplast genomes.
| Regions | Alignment Length (bp) | Number of Variable Sites | Nucleotide Polymorphism | |||
|---|---|---|---|---|---|---|
| Polymorphic | Singleton | Parsimony Informative | Nucleotide Diversity | Haplotypes | ||
| LSC | 84,949 | 1704 | 1149 | 549 | 0.00457 | 12 |
| SSC | 11,527 | 455 | 298 | 157 | 0.00926 | 12 |
| IR | 24,617 | 96 | 68 | 28 | 0.00087 | 11 |
| Whole plastomes | 145,671 | 2352 | 1582 | 764 | 0.00366 | 12 |
Table 3.
Comparison of GTR partition models from maximum likelihood analysis of the 70 g 50 s dataset.
Table 3.
Comparison of GTR partition models from maximum likelihood analysis of the 70 g 50 s dataset.
| GTR Model Partition | No. Partitions | 2logeL | No. Free Parameters | AICc |
|---|---|---|---|---|
| Unpartitioned | 1 | −268,402.7677 | 106 | 537,017.9356 |
| Gene partitioned | 32 | −263,732.8419 | 416 | 528,303.8397 |
| hcluster | 57 | −263,607.1139 | 681 | 528,592.7872 |
| rcluster | 36 | −263,643.0715 | 474 | 528,242.1411 |
Publisher’s Note: MDPI stays neutral with regard to jurisdictional claims in published maps and institutional affiliations. |
© 2021 by the authors. Licensee MDPI, Basel, Switzerland. This article is an open access article distributed under the terms and conditions of the Creative Commons Attribution (CC BY) license (https://creativecommons.org/licenses/by/4.0/).
Share and Cite
MDPI and ACS Style
Liu, X.; Xu, D.; Hong, Z.; Zhang, N.; Cui, Z. Comparative and Phylogenetic Analysis of the Complete Chloroplast Genome of Santalum (Santalaceae). Forests 2021, 12, 1303. https://doi.org/10.3390/f12101303
AMA Style
Liu X, Xu D, Hong Z, Zhang N, Cui Z. Comparative and Phylogenetic Analysis of the Complete Chloroplast Genome of Santalum (Santalaceae). Forests. 2021; 12(10):1303. https://doi.org/10.3390/f12101303
Chicago/Turabian StyleLiu, Xiaojin, Daping Xu, Zhou Hong, Ningnan Zhang, and Zhiyi Cui. 2021. "Comparative and Phylogenetic Analysis of the Complete Chloroplast Genome of Santalum (Santalaceae)" Forests 12, no. 10: 1303. https://doi.org/10.3390/f12101303
Note that from the first issue of 2016, this journal uses article numbers instead of page numbers. See further details here.