
Wind–Water Experimental Analysis of Small SC-Darrieus Turbine: An Approach for Energy Production in Urban Systems

 ,
,  , , and
Abstract
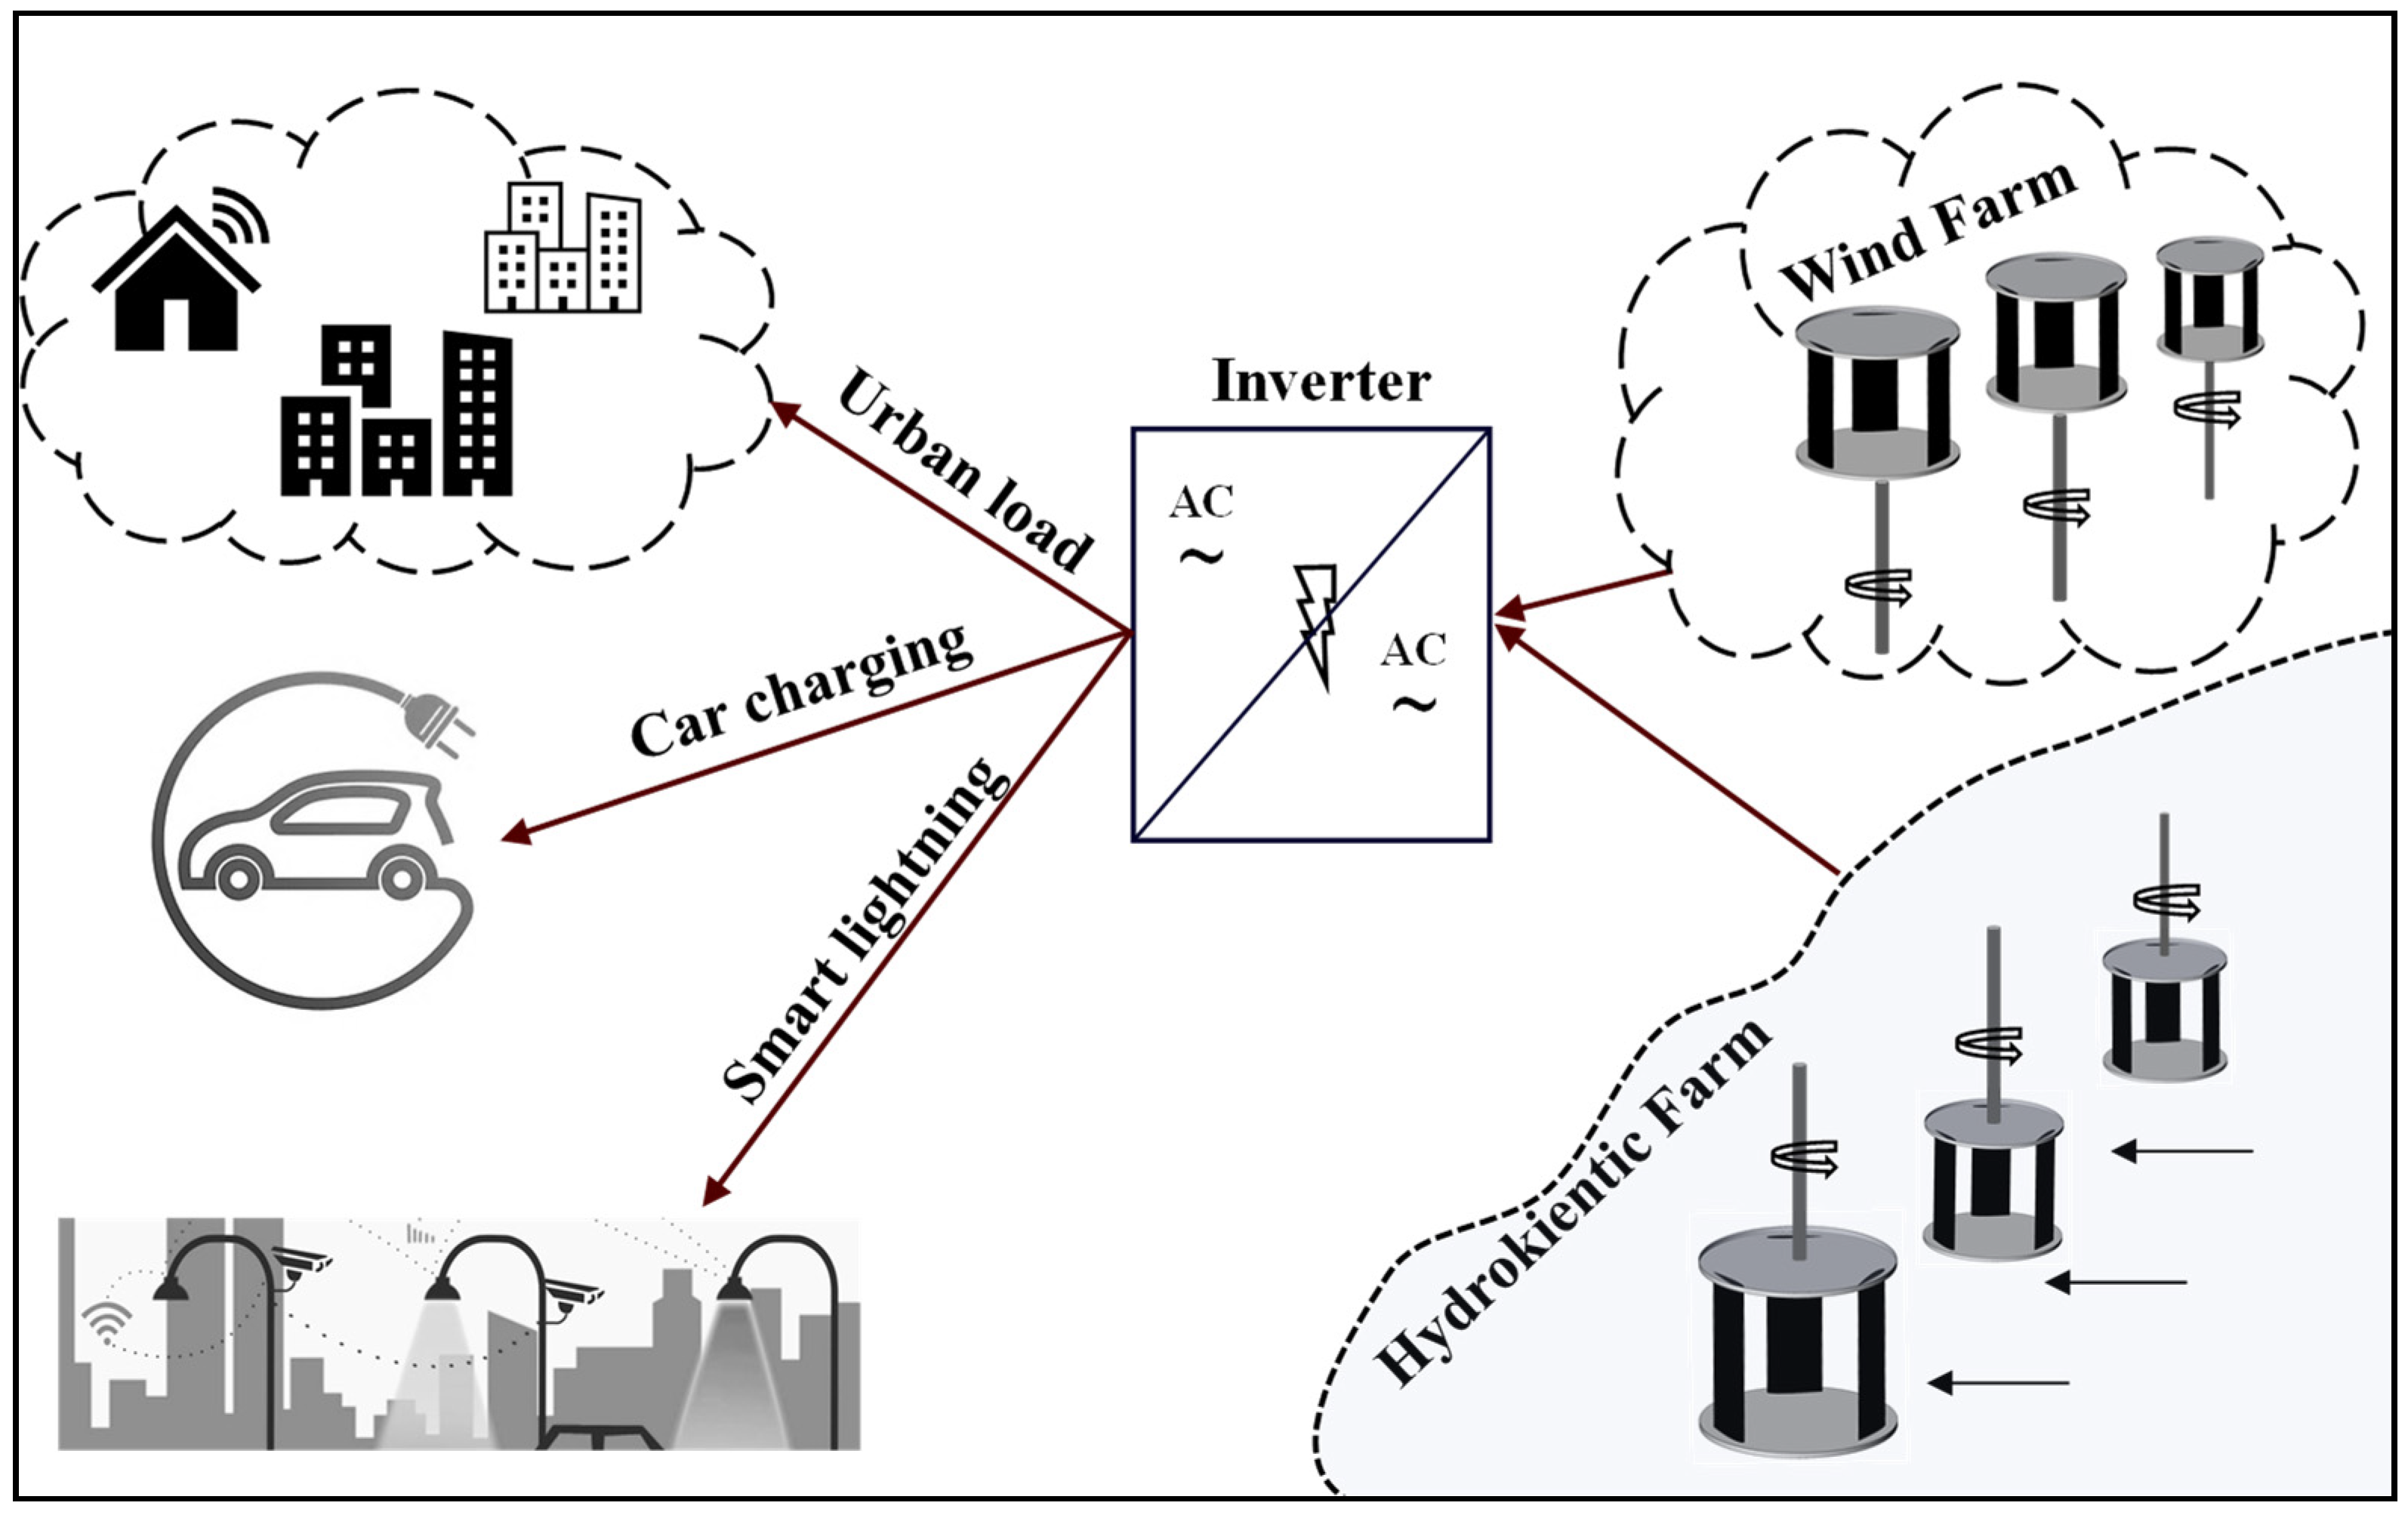
:1. Introduction
2. Theoretical Bases
2.1. Wind Bases
2.2. Water Bases
- The disc is submerged in water and under blockage conditions.
- Two different zones with uniform flow are distinguished upstream and downstream of the disc.
- A mixing zone also appears due to turbulence phenomena, being located just after the disc.
2.3. Testing Parameters
3. Materials and Methods
3.1. Rotor Description
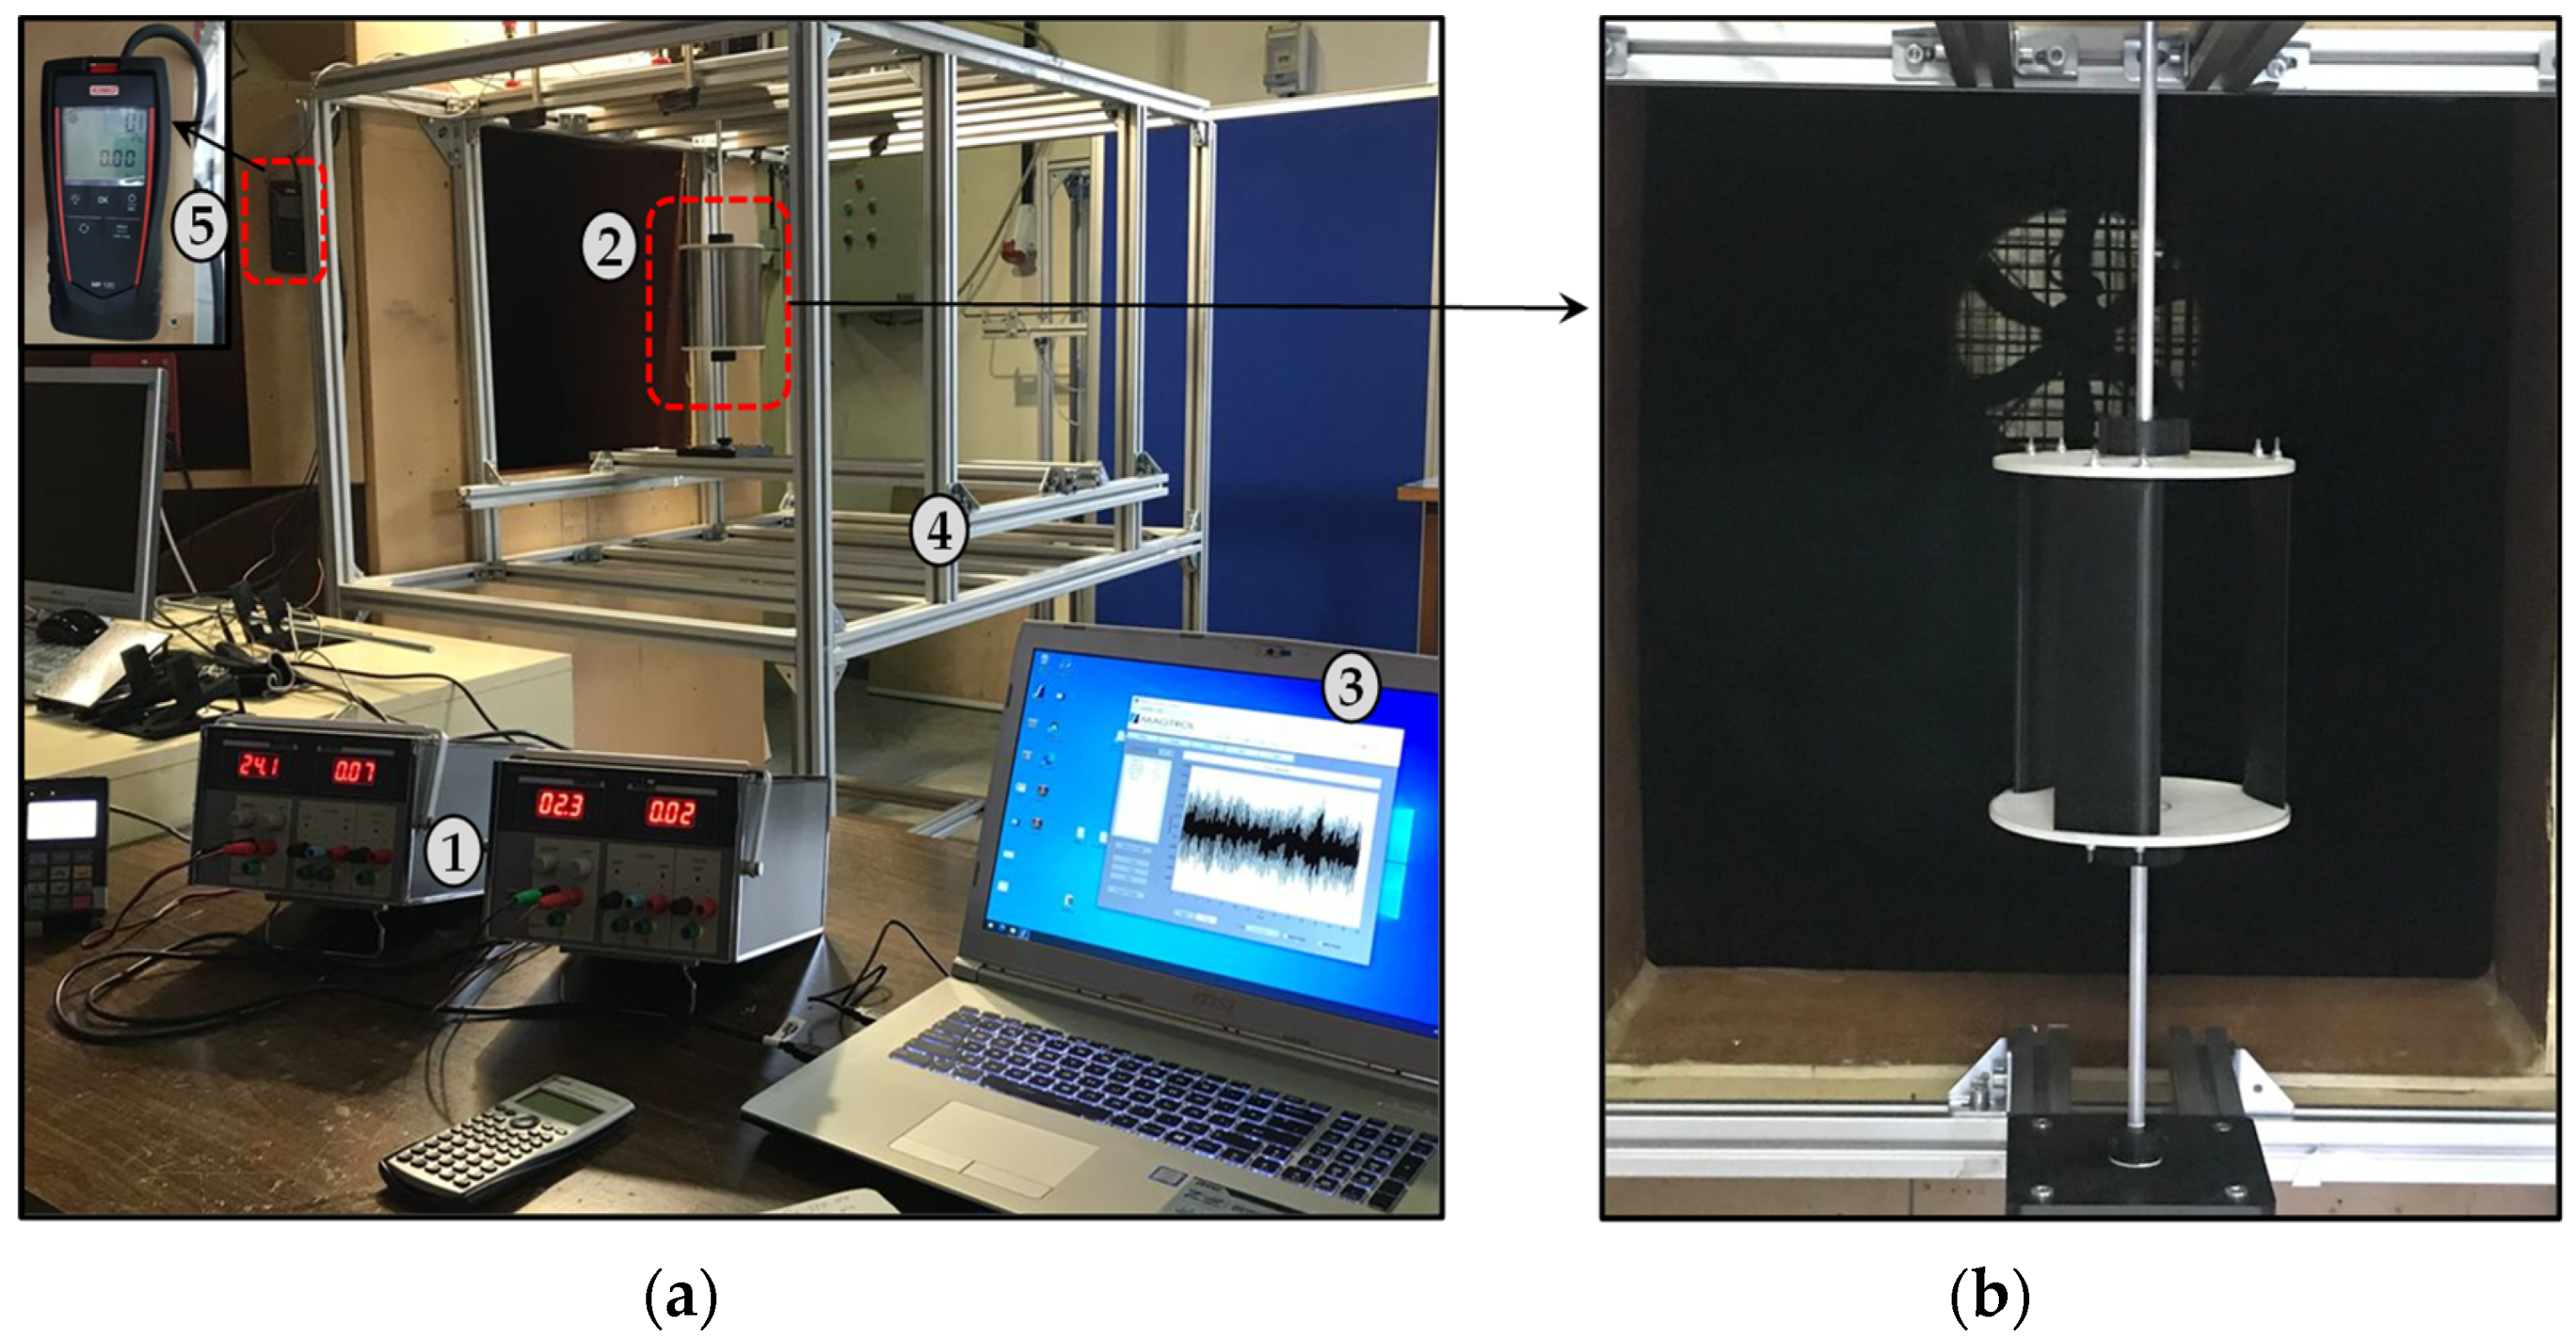
3.2. Wind Tunnel Description
3.3. Water Flume Description
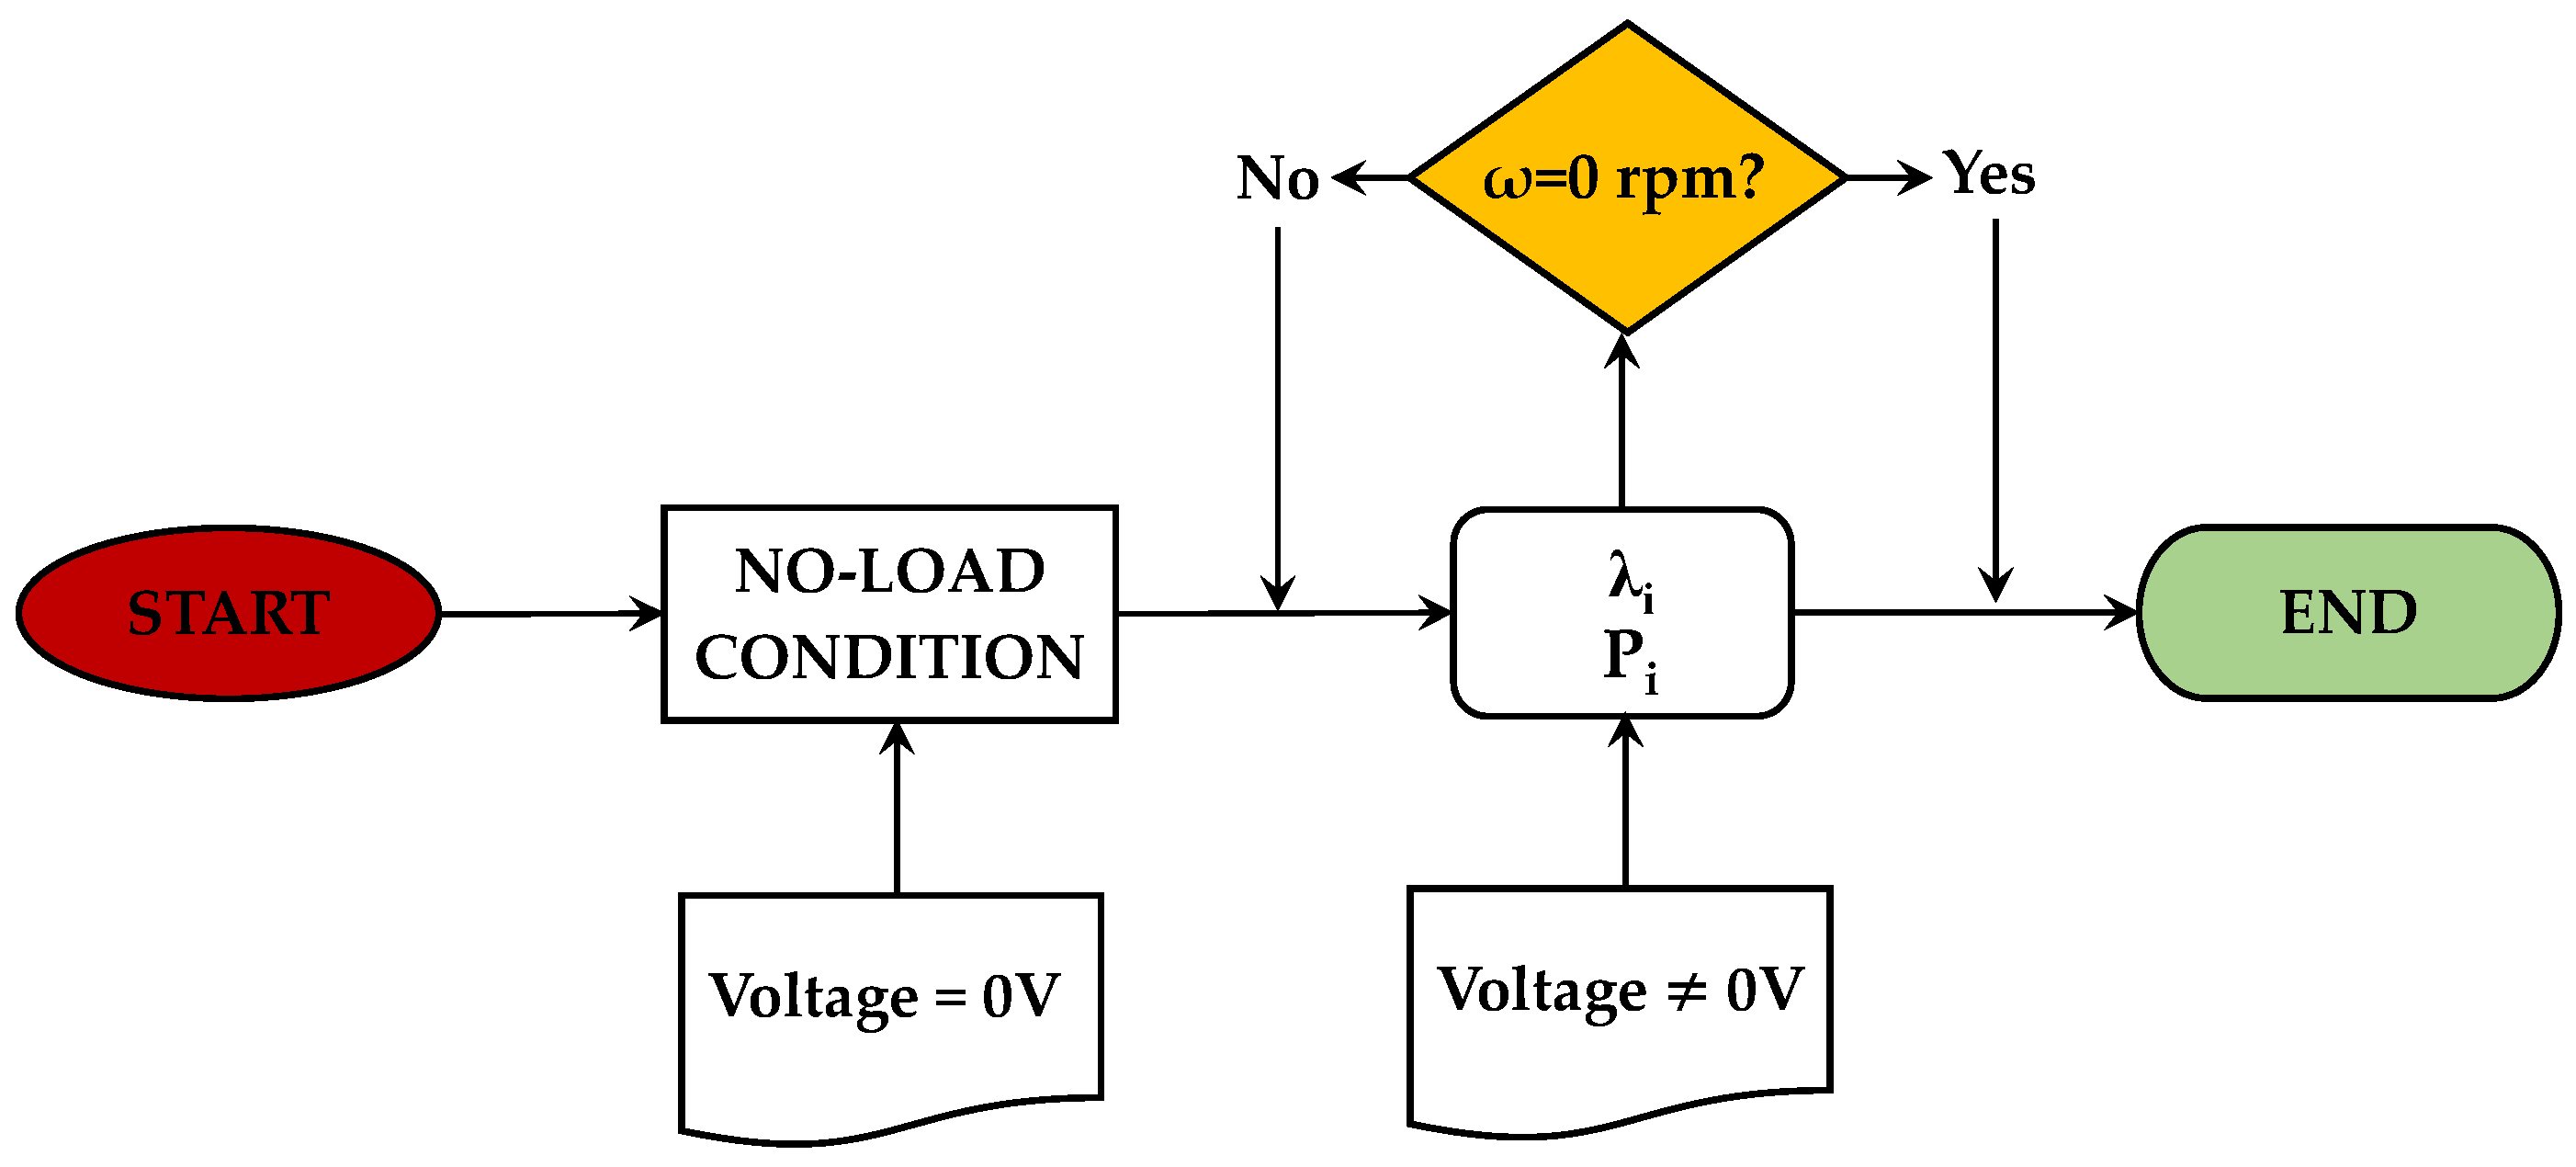
3.4. Testing Procedure
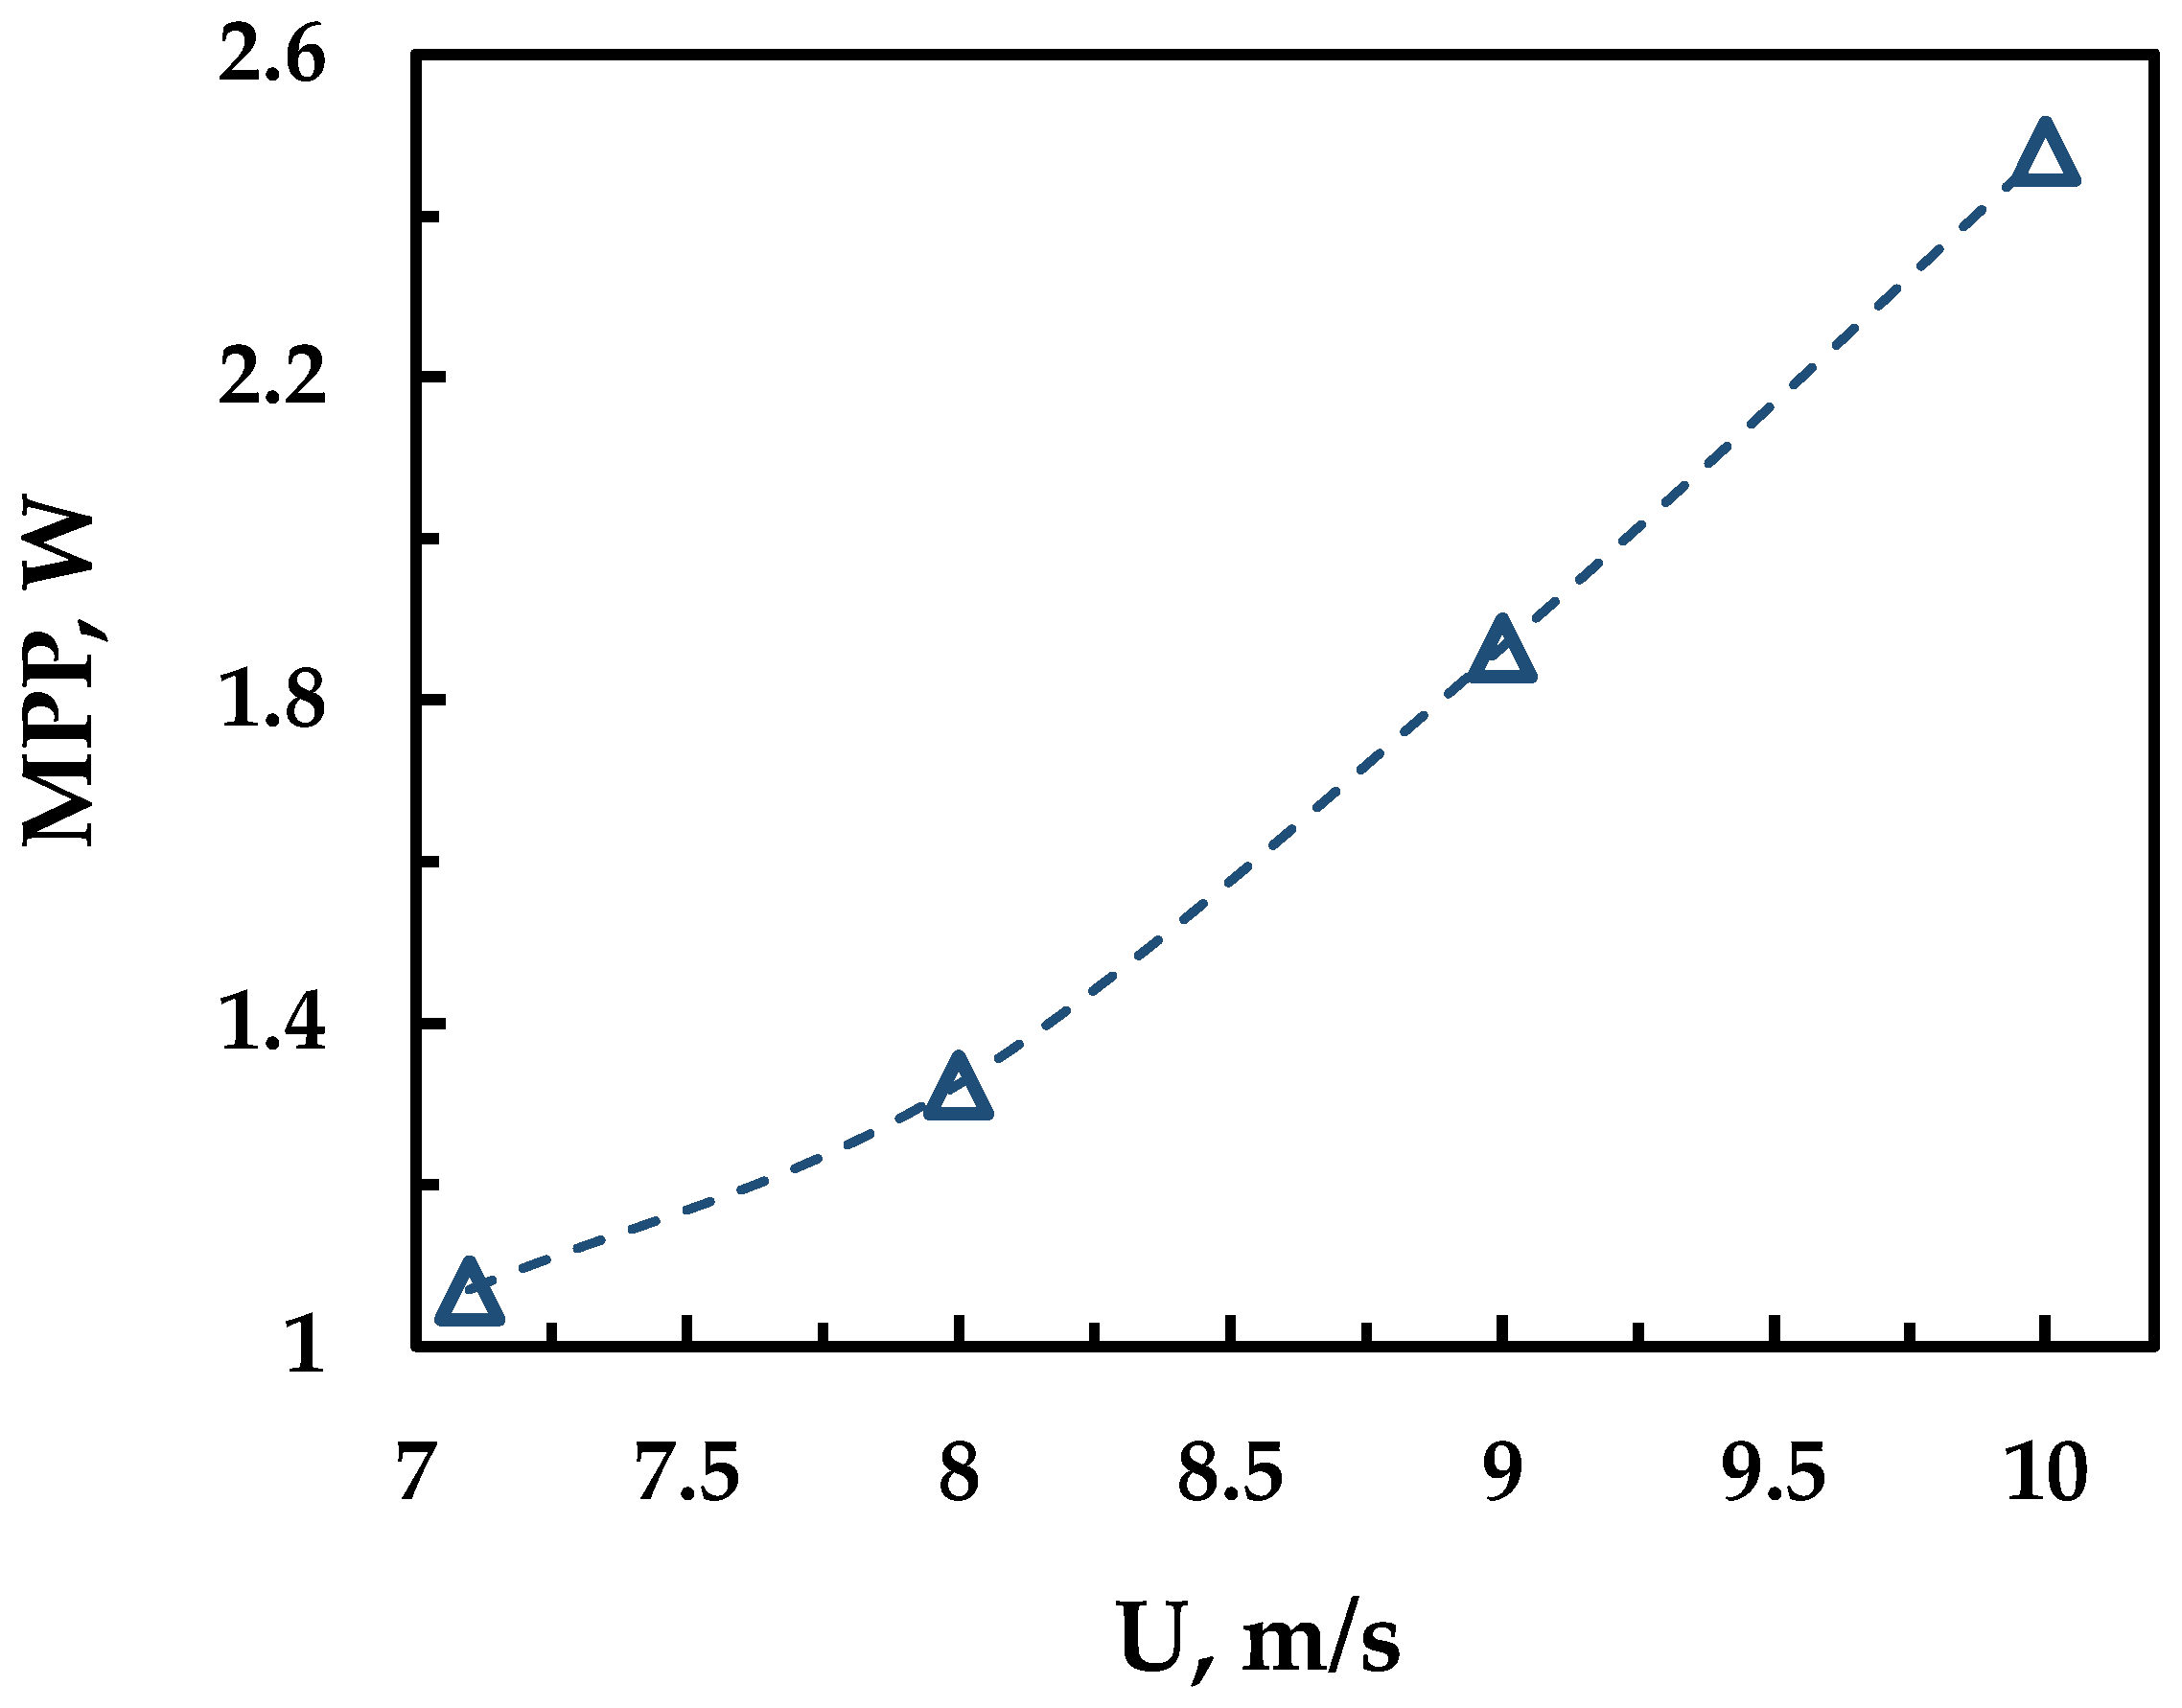
4. Results and Discussion
5. Conclusions
Author Contributions
Funding
Institutional Review Board Statement
Informed Consent Statement
Acknowledgments
Conflicts of Interest
References
- Espejo-Marín, C.; Aparicio-Guerrero, A.E. La Producción de Electricidad con Energía Solar Fotovoltaica en España en el Siglo XXI. Cuad. Sobre Vico 2020, 66–93. [Google Scholar] [CrossRef]
- Díaz, H.; Soares, C.G. Review of the current status, technology and future trends of offshore wind farms. Ocean Eng. 2020, 209, 107381. [Google Scholar] [CrossRef]
- IEA. Energy Technology Perspectives 2020. Available online: https://www.iea.org/reports/energy-technology-perspectives-2020 (accessed on 8 May 2020).
- REN21. Renewables 2020 Global Status Report 2020. Available online: https://www.ren21.net/gsr-2020/ (accessed on 8 May 2020).
- IRENA. Global Renewables Outlook: Energy Transformation 2050; 2020. Available online: https://www.irena.org/publications/2020/Apr/Global-Renewables-Outlook-2020#:~:text=Global%20Renewables%20Outlook%3A%20Energy%20transformation%202050,-April%202020&text=The%20Global%20Renewables%20Outlook%20shows,challenges%20faced%20by%20different%20regions (accessed on 8 May 2020).
- Oreste, F.; Vittorio, M.G.; Francesco, P. Numerical assessment of the vulnerability to impact erosion of a pump as turbine in a water supply system. J. Hydroinformat. 2020, 22, 691–712. [Google Scholar] [CrossRef]
- Malael, I.; Gherman, G.B.; Porumbel, I. Increase the Smart Cities Development by Using an Innovative Design for Vertical Axis Wind Turbine. In Proceedings of the 27th DAAAM International Symposium on Intelligent Manufacturing and Automation, Vienna, Austria, 26–29 October 2016; pp. 506–513. [Google Scholar]
- Alvarez, E.A.; Rico-Secades, M.; Corominas, E.; Huerta-Medina, N.; Guitart, J.S. Design and control strategies for a modular hydroKinetic smart grid. Int. J. Electr. Power Energy Syst. 2018, 95, 137–145. [Google Scholar] [CrossRef]
- Yuan, Z.; Wang, W.; Fan, X. Back propagation neural network clustering architecture for stability enhancement and harmonic suppression in wind turbines for smart cities. Comput. Electr. Eng. 2019, 74, 105–116. [Google Scholar] [CrossRef]
- Mohammadi, S.; Hassanalian, M.; Arionfard, H.; Bakhtiyarov, S. Optimal design of hydrokinetic turbine for low-speed water flow in Golden Gate Strait. Renew. Energy 2020, 150, 147–155. [Google Scholar] [CrossRef]
- Lee, J.H.; Park, S.; Kim, D.H.; Rhee, S.H.; Kim, M.-C. Computational methods for performance analysis of horizontal axis tidal stream turbines. Appl. Energy 2012, 98, 512–523. [Google Scholar] [CrossRef]
- Consul, C.A.; Willden, R.H.J.; Ferrer, E.; Mcculloch, M.D. Influence of Solidity on the Performance of a Cross-Flow Turbine. In Proceedings of the 8th European Wave and Tidal Energy Conference, Uppsala, Sweden, 7–10 September 2009; pp. 484–493. [Google Scholar]
- Khan, M.; Bhuyan, G.; Iqbal, M.; Quaicoe, J. Hydrokinetic energy conversion systems and assessment of horizontal and vertical axis turbines for river and tidal applications: A technology status review. Appl. Energy 2009, 86, 1823–1835. [Google Scholar] [CrossRef]
- Kaprawi, S.; Santoso, D.; Sipahutar, R. Performance of combined water turbine darrieus-savonius with two stage savonius buckets and single deflector. Int. J. Renew. Energy Res. 2015, 5, 217–221. [Google Scholar]
- Vermaak, H.J.; Kusakana, K.; Koko, S.P. Status of micro-hydrokinetic river technology in rural applications: A review of literature. Renew. Sustain. Energy Rev. 2014, 29, 625–633. [Google Scholar] [CrossRef]
- Le Hocine, A.E.B.; Lacey, R.J.; Poncet, S. Multiphase modeling of the free surface flow through a Darrieus horizontal axis shallow-water turbine. Renew. Energy 2019, 143, 1890–1901. [Google Scholar] [CrossRef]
- Balduzzi, F.; Zini, M.; Molina, A.C.; Bartoli, G.; De Troyer, T.; Runacres, M.C.; Ferrara, G.; Bianchini, A. Understanding the Aerodynamic Behavior and Energy Conversion Capability of Small Darrieus Vertical Axis Wind Turbines in Turbulent Flows. Energies 2020, 13, 2936. [Google Scholar] [CrossRef]
- Sinagra, M.; Sammartano, V.; Aricò, C.; Collura, A.; Tucciarelli, T. Cross-flow Turbine Design for Variable Operating Conditions. Procedia Eng. 2014, 70, 1539–1548. [Google Scholar] [CrossRef] [Green Version]
- Yosry, A.G.; Fernández-Jiménez, A.; Álvarez-Álvarez, E.; Marigorta, E.B. Design and characterization of a vertical-axis micro tidal turbine for low velocity scenarios. Energy Convers. Manag. 2021, 237, 114144. [Google Scholar] [CrossRef]
- Glauert, H. Wind Tunnel Interference on Wings, Bodies and Airscrews. Aeronaut. Res. Comm. 1933, 1566, 1–52. [Google Scholar]
- Gauvin-Tremblay, O.; Dumas, G. Two-way interaction between river and deployed cross-flow hydrokinetic turbines. J. Renew. Sustain. Energy 2020, 12, 034501. [Google Scholar] [CrossRef]
- Schluntz, J.; Willden, R. The effect of blockage on tidal turbine rotor design and performance. Renew. Energy 2015, 81, 432–441. [Google Scholar] [CrossRef]
- Vennell, R. Exceeding the Betz limit with tidal turbines. Renew. Energy 2013, 55, 277–285. [Google Scholar] [CrossRef]
- Bahaj, A.; Molland, A.; Chaplin, J.; Batten, W. Power and thrust measurements of marine current turbines under various hydrodynamic flow conditions in a cavitation tunnel and a towing tank. Renew. Energy 2007, 32, 407–426. [Google Scholar] [CrossRef]
- Werle, M.J. Wind Turbine Wall-Blockage Performance Corrections. J. Propuls. Power 2010, 26, 1317–1321. [Google Scholar] [CrossRef]
- Soerensen, H.C.; Weinstein, A. Ocean Energy: Position Paper for IPCC. In Proceedings of the Scoping Meeting on Renewable Energy Sources and Climate Change Mitigation, Lübeck, Germany, 20–25 January 2008; pp. 93–102. [Google Scholar]
- Birjandi, A.H.; Bibeau, E.L.; Chatoorgoon, V.; Kumar, A. Power measurement of hydrokinetic turbines with free-surface and blockage effect. Ocean Eng. 2013, 69, 9–17. [Google Scholar] [CrossRef]
- Bachant, P.; Wosnik, M. Performance measurements of cylindrical- and spherical-helical cross-flow marine hydrokinetic turbines, with estimates of exergy efficiency. Renew. Energy 2015, 74, 318–325. [Google Scholar] [CrossRef]
- Kolekar, N.; Vinod, A.; Banerjee, A. On Blockage Effects for a Tidal Turbine in Free Surface Proximity. Energies 2019, 12, 3325. [Google Scholar] [CrossRef] [Green Version]
- A Consul, C.; Willden, R.H.J.; McIntosh, S.C. Blockage effects on the hydrodynamic performance of a marine cross-flow turbine. Philos. Trans. R. Soc. A Math. Phys. Eng. Sci. 2013, 371, 20120299. [Google Scholar] [CrossRef] [PubMed]
- Brochier, G.; Fraunie, P.; Beguier, C.; Paraschivoiu, I. Water channel experiments of dynamic stall on Darrieus wind turbine blades. J. Propuls. Power 1986, 2, 445–449. [Google Scholar] [CrossRef]
- Fujisawa, N.; Shibuya, S. Observations of dynamic stall on Darrieus wind turbine blades. J. Wind. Eng. Ind. Aerodyn. 2001, 89, 201–214. [Google Scholar] [CrossRef]
- Sherry, M.; Sheridan, J.; Jacono, D.L. Horizontal Axis Wind Turbine Tip and Root Vortex Measurements. Exp. Fluids 2013, 54, 3. [Google Scholar] [CrossRef] [Green Version]
- Iungo, G.V.; Viola, F.; Camarri, S.; Porté-Agel, F.; Gallaire, F. Linear stability analysis of wind turbine wakes performed on wind tunnel measurements. J. Fluid Mech. 2013, 737, 499–526. [Google Scholar] [CrossRef] [Green Version]
- Hiraki, K.; Wakita, R.; Inoue, M. Improvement of straight-bladed vertical-axis water turbine for tidal current power generation. In Proceedings of the 9th ISOPE Pacific/Asia Offshore Mechanics Symposium (PACOMS-2010), Busan, Korea, 14–17 November 2010; pp. 169–174. [Google Scholar]
- Shahsavarifard, M.; Bibeau, E.L.; Chatoorgoon, V. Effect of shroud on the performance of horizontal axis hydrokinetic turbines. Ocean Eng. 2015, 96, 215–225. [Google Scholar] [CrossRef] [Green Version]
- Jeong, H.; Lee, S.; Kwon, S.-D. Blockage corrections for wind tunnel tests conducted on a Darrieus wind turbine. J. Wind. Eng. Ind. Aerodyn. 2018, 179, 229–239. [Google Scholar] [CrossRef]
- Ruiz, S.N. Aerogeneradores de Media Potencia; CIEMAT: Madrid, Spain, 2020. [Google Scholar]
- Betz, A. Der Maximum der theoretisch möglichen Ausnutzung des Windesdurch Windmotoren. Z. Gesamte Turbinenwes 1920, 26, 307–309. [Google Scholar]
- Nishino, T.; Willden, R.H.J. The efficiency of an array of tidal turbines partially blocking a wide channel. J. Fluid Mech. 2012, 708, 596–606. [Google Scholar] [CrossRef]
- Draper, S.; Houlsby, G.T.; Oldfield, M.L.G.; Borthwick, A.G.L. Modelling tidal energy extraction in a depth-averaged coastal domain. IET Renew. Power Gener. 2010, 4, 545. [Google Scholar] [CrossRef] [Green Version]
- Houlsby, G.T.; Vogel, C.R. The power available to tidal turbines in an open channel flow. Proc. Inst. Civ. Eng. Energy 2017, 170, 12–21. [Google Scholar] [CrossRef]
- Espina-Valdés, R.; Fernández-Jiménez, A.; Francos, J.F.; Marigorta, E.B.; Álvarez-Álvarez, E. Small cross-flow turbine:Design and testing in high blockage conditions. Energy Convers. Manag. 2020, 213, 112863. [Google Scholar] [CrossRef]
- Álvarez-Álvarez, E.; Rico-Secades, M.; Fernández-Jiménez, A.; Espina-Valdés, R.; Corominas, E.L.; Calleja-Rodríguez, A.J. Hydrodynamic water tunnel for characterization of hydrokinetic microturbines designs. Clean Technol. Environ. Policy 2020, 22, 1843–1854. [Google Scholar] [CrossRef] [PubMed]
- Patel, V.; Eldho, T.; Prabhu, S. Experimental investigations on Darrieus straight blade turbine for tidal current application and parametric optimization for hydro farm arrangement. Int. J. Mar. Energy 2017, 17, 110–135. [Google Scholar] [CrossRef]
- Burton, T.; Jenkins, N.; Sharpe, D.; Bossanyi, E. Wind Energy Handbook; John Wiley & Sons, Ltd.: Chichester, UK, 2011. [Google Scholar]
- Calignano, F.; Lorusso, M.; Roppolo, I.; Minetola, P. Investigation of the Mechanical Properties of a Carbon Fibre-Reinforced Nylon Filament for 3D Printing. Machines 2020, 8, 52. [Google Scholar] [CrossRef]


| Flow Velocity (m/s) | Blockage Ratio (BR%) | |
|---|---|---|
| Wind tests | 7.1, 8, 9, and 10 | 6.8 |
| Water tests | 0.71, 0.73, 0.75, and 0.78 | 20, 25.1, 31.8, and 34.1 |
Publisher’s Note: MDPI stays neutral with regard to jurisdictional claims in published maps and institutional affiliations. |
© 2021 by the authors. Licensee MDPI, Basel, Switzerland. This article is an open access article distributed under the terms and conditions of the Creative Commons Attribution (CC BY) license (https://creativecommons.org/licenses/by/4.0/).
Share and Cite
Gharib-Yosry, A.; Blanco-Marigorta, E.; Fernández-Jiménez, A.; Espina-Valdés, R.; Álvarez-Álvarez, E. Wind–Water Experimental Analysis of Small SC-Darrieus Turbine: An Approach for Energy Production in Urban Systems. Sustainability 2021, 13, 5256. https://doi.org/10.3390/su13095256
Gharib-Yosry A, Blanco-Marigorta E, Fernández-Jiménez A, Espina-Valdés R, Álvarez-Álvarez E. Wind–Water Experimental Analysis of Small SC-Darrieus Turbine: An Approach for Energy Production in Urban Systems. Sustainability. 2021; 13(9):5256. https://doi.org/10.3390/su13095256
Chicago/Turabian StyleGharib-Yosry, Ahmed, Eduardo Blanco-Marigorta, Aitor Fernández-Jiménez, Rodolfo Espina-Valdés, and Eduardo Álvarez-Álvarez. 2021. "Wind–Water Experimental Analysis of Small SC-Darrieus Turbine: An Approach for Energy Production in Urban Systems" Sustainability 13, no. 9: 5256. https://doi.org/10.3390/su13095256