
Data Management for Environmentally Sustainable and Profitable Business: Evidence from the Food Retail Industry

1
School of Engineering, University of Wollongong in Dubai, Dubai P.O. Box 20183, United Arab Emirates
2
School of Business, University of Wollongong in Dubai, Dubai P.O. Box 20183, United Arab Emirates
*
Author to whom correspondence should be addressed.
Sustainability 2023, 15(23), 16298; https://doi.org/10.3390/su152316298
Submission received: 14 October 2023
/
Revised: 6 November 2023
/
Accepted: 13 November 2023
/
Published: 25 November 2023
Abstract
:Climatic changes are now a global reality with widespread repercussions for individuals and businesses worldwide. The responsibility to adapt behaviors and protect the environment is shared by all of humanity. Business leaders can play a pivotal role in expediting this transformation by shifting their focus from pure profit-seeking to becoming value-driven entities that actively contribute to societal betterment while championing environmental conservation and sustainable profitability. This transition, however, poses certain challenges, notably the higher costs associated with ecofriendly materials, which can strain a company’s financial equilibrium. Furthermore, a significant number of organizations overlook the untapped potential of their data, a valuable asset that could significantly bolster their competitive position. To address these challenges, this study aims to provide actionable guidance for business leaders by using a notable data framework to reassess their capabilities and dynamically adapt to external environments. Our method relies on data mining algorithms and business intelligence tools to report data. The results pinpoint which products are greatly in demand, so leaders can be assured their investment in redesigning products yields profit, improves product freshness, and eliminates waste. By bridging the gap between profitability and environmental responsibility, this study endeavors to empower businesses to thrive in a sustainable, value-driven future.
1. Introduction
In the contemporary global landscape, the undeniable reality of climate change has emerged as a pervasive force, impacting individuals and businesses worldwide, and since COP26, there has been very little development toward achieving the enormous reduction in the emission gap planned for 2030 to attain the temperature objectives set by the Paris agreement [1]. As this challenge looms large, the responsibility to adapt behaviors and protect the environment is an imperative shared by all humanity. These challenges can result in drastic economic [2] that affect businesses’ ability to provide necessary food products to meet customers’ demands because climate change can impact natural resources that are imperative to successful companies’ operations, such as seawater levels, hurricanes, drought, and floods. Additionally, these challenges could affect customers’ preferences or ability to buy certain products. Many supermarkets to this date consider themselves sustainable, while their contribution is small and superficial. Furthermore, companies that fail to manage their data quality will be vulnerable to huge financial losses [3]. Hence, our research focuses on guiding companies to manage their data and use it to deeply understand their customers, thus identifying opportunities to innovate and improve their strategy. Recent research [4] elaborates that almost every industry causes the emission of greenhouse gases, and the food industry is liable for a third of all emissions caused by humans. Therefore, it is essential that the food industry radically transform. As a result, some food-producing companies created sustainable products that are plant-based, such as soy or oat milk. Another study [5] claims that despite the widespread use of biodegradable plastic (BDP) as an alternative to traditional plastic packaging, there are still some concerns about the harm caused by BDP, because it needs special environmental conditions which could vary among several farmlands, besides other plastic residues that contaminate the soil. However, in the midst of shared responsibility, business leaders possess the unique potential to serve as a catalyst for transformative change. This transformative potential hinges on a profound shift in perspective—a shift from a singular focus on profit-seeking to embracing a broader vision as value-driven entities. Indeed, prior research [6] states that innovation toward an environmentally sustainable company could lead to a ‘win-win’ situation for the economy and the environment. Such entities actively contribute to societal betterment while concurrently championing environmental conservation and sustainable profitability. Although this transition is not without its formidable challenges, foremost among these challenges is the inherent costliness associated with ecofriendly materials. As discussed in [7], Alibaba used biodegradable plastic to be environmentally sustainable. However, that came at huge costs, especially when shipping items from distribution centers to the customers, because they had to use lots of this plastic to protect these items during transportation. Another source [8] explained that people who want to buy products that are sustainable, or in a sustainable way, have difficulties during shopping since there are only a few sustainable products that are very expensive. On the other hand, if supermarkets and grocery stores become sustainable, then only a few people will be able to buy their products. These costs have the potential to strain a company’s financial equilibrium [7]. Thus, business leaders must navigate a delicate balancing act between ethical imperatives and fiscal responsibilities. A troubling trend also emerges within the corporate realm: a significant number of organizations fail to harness the latent potential of their data. This oversight, marked by an inability to capitalize on data’s transformative power, stands as a substantial barrier to progress [3].
Within this intricate landscape, this study takes root with a resolute purpose to instill the importance of sustainability in the company’s mission by directing toward sustainable innovation that aims to benefit the citizens, the economy, and the planet [9], which is also known as the triple-bottom-line, and by providing actionable guidance to business leaders grappling with the complexities of sustainability, innovation, and adaptability. We focus on data management, recognizing innovation as a lodestar, and cultivating adaptability as an essential trait [10], while our intention is to satisfy and retain customers. The main priority is to begin by practicing social responsibility internally [9] starting with workers, their development, and their quality of life, which will reflect on everything external such as customers, environment, and prosperity. To elaborate, a company can embed social responsibility internally by fostering a caring community where employees can volunteer in social responsibility activities that give them a sense of purpose and develop them at the same time. To name a few, some companies created a sustainable CSR program that encourages staff to group teams and participate in removing food waste from the shores; such an activity could develop a sense of team spirit and collaboration among them, and for a great cause that benefits the environment and people. Through the synthesis of these elements, this study endeavors to bridge the gap between profitability and environmental responsibility, serving as a guiding light toward a future where businesses not only endure but thrive in a sustainable, value-driven paradigm [11,12]. To do so, we focus on the food retail industry, where the impact of climate change on food security is highly pronounced [13]. Leaders in this industry face a pressing need to innovate and reduce food waste in response to these challenges. The urgency of this matter is further underscored by Geyer et al. [11], who estimated that production of raw plastic in 2017 reached a staggering 8300 million metric tons. Projections suggest that if current trends persist, this figure could increase to approximately 12,000 million metric tons in landfills by 2050. Additionally, Gibbens [12] highlights the opportunities for innovation in addressing the plastic problem and emphasizes that alternatives to traditional plastics, such as milk, petroleum, or plant-based materials, offer the potential for marine degradability and cost-effectiveness. However, to effectively pursue such innovations, business leaders in the food retail industry must have access to high-quality data that allows them to respond swiftly to changing customer demands. Neglecting data quality can result in dire consequences, including financial losses and missed opportunities. As Moore [3] estimates, poor data quality is responsible for approximately 15 million dollars in losses every year. Therefore, it is imperative for decision-makers to prioritize the acquisition of top-tier data as a foundational step in driving innovation and strategic planning, particularly in the food retail industry.
2. Literature Review
In the evolving landscape of business ethics, a transformation is underway. Once firmly anchored in the domain of applied philosophy, business ethics is now seen as drawing from two distinct tributaries: environmental management and corporate social responsibility (CSR) [14]. This transformation reflects a strategic shift, aligning business ethics with an examination of a business’s intrinsic character. In essence, it calls for critical scrutiny of the normative dimensions of business operations and applying sound reasoning aimed at achieving the best sort of life for the greatest number of people. Simultaneously, trustworthiness has emerged as a competitive advantage, as suggested by Barney and Hansen [15]. Trust takes on different forms in the business landscape, ranging from weak trust in situations devoid of moral decisions and limited opportunities to semistrong trust, where decisions align with established standards to avoid ethical violations, and finally to strong trust, where partners consistently act in a trustworthy manner, lest their behavior contradicts established values. Emphasizing the symbiotic relationship between ethics and business success, Orlitzky [16] also underscores the merits of high CSR in enhancing a company’s competitive edge.
This perspective, termed the ‘good management theory,’ underscores the equitable and rational alignment of stakeholder demands with corporate actions. Data and ethics converge as Michalos [17] scrutinizes CSR reports. Here, the discrepancy in stakeholder opinions regarding CSR activities and their associated value becomes evident. The core distinction lies in whether companies embrace ethical practices solely for profit or genuinely aspire to ‘do the right thing’. This research ardently advocates for enhanced CSR measurements and greater transparency in performance reporting. In the context of environmental responsibility, the integration of blockchain technology and artificial intelligence (AI) to enforce CSR essentials emerges as an innovative approach [18]. This innovation holds the potential to uphold fundamental human principles, resolve AI’s ethical dilemmas arising from noncompliance with environmental standards, and influence customer experiences. Turning to big data, researchers have dissected the challenges posed by vast volumes, velocity, and variety of data [19]. To transition successfully from traditional data to big data, businesses must navigate several critical steps, from visionary leadership to successful talent management, continuous technological learning, data-driven decision-making, and shaping organizational culture in tandem with data structure. Further refining data strategy, Davenport [20] delineates two strategic approaches—defensive and offensive. The defensive stance seeks a single source of truth governed by rules and standards, while the offensive approach leans towards customer-centricity and dynamic adaptation to their evolving needs. Data emerges as the linchpin of digital transformation [21]. Effective data utilization underpins decision-making and innovation. Yet, success in digital transformation remains elusive for many, with only a fraction of companies managing to implement successful strategies. These trailblazers, as research indicates, realize an eightfold return on investment, complete projects ahead of schedule, and enhance customer experiences [22].
In the context of the food retail industry, the application of IoT sensors to gauge food freshness emerges as a prime example of data’s transformative potential [23]. These sensors monitor critical elements such as temperature and humidity, effectively reducing food waste and enhancing overall efficiency. Quantitative analysis stands as a cornerstone of data-driven decision-making, with descriptive, predictive, and prescriptive analytics playing pivotal roles [22]. Each form serves a distinct purpose, from reporting on current conditions to forecasting future outcomes and guiding immediate action. The value proposition of data analysis further refines the role of data within organizations. A successful value proposition not only aligns with a company’s objectives but also minimizes misunderstandings among stakeholders [24]. Despite the potential data holds, many companies still struggle to align their overall strategy with data strategy [25]. This misalignment often results in data-rich but information-poor organizations, stemming from unrealistic expectations, talent shortages, and a reliance on intuition over data-informed decisions. Embracing a data-driven culture emerges as the remedy, with chief data officers and data experts assuming the mantle of change agents. Data literacy emerges as a linchpin for success in data-driven organizations [19]. When every employee understands their role and the timing of data sharing, organizations reap the benefits of a data-driven culture. Digital transformation, while promising, remains an arena fraught with ambiguity. The empirical evidence suggests that experimentation is a crucial component of successful digital transformation, particularly in dynamic environments [26]. A design-thinking approach to digital transformation projects proves invaluable, fostering innovation that is human-centered and rooted in an understanding of customer profiles. However, while prior research broadly discusses the importance of business leaders shifting toward value-driven entities, they do not delve into specific practical strategies or case studies that demonstrate how companies can effectively navigate the challenges of adopting ecofriendly materials and leveraging data for environmental responsibility. In this study, we attempt to fill this gap.
3. Methods
In this section, we present the quantitative nature of our research, underpinned by our overarching goal of enhancing decision-making processes within the food retail industry, specifically, by segmenting customers’ product choices in relation to the attributes that cause pollution, such as plastic covers and purchase frequency. Next, by tracking patterns in customers’ purchases, finding opportunities to increase sustainable and healthier products in customers’ baskets, and finally, monitoring customers’ purchase different trends, we can predict their demands and uncover opportunities to innovate. Our choice of the food retail sector as a context for this research is justified by several compelling reasons.
Firstly, our data collection process involved the deliberate and random selection of a wide array of products commonly available in local supermarkets and on the largest online retail platform, Amazon (www.amazon.ae accessed on 1 March 2023). This diversity mirrors the complex and ever-evolving nature of the food retail industry, which encompasses a vast array of products, suppliers, and consumer preferences. By selecting products from both physical and digital marketplaces, we aimed to capture the industry’s multifaceted landscape, highlighting the need for versatile analytical techniques.
Furthermore, the food retail sector is deeply entwined with contemporary sustainability challenges. While plastic bag overuse has been widely discussed, it is imperative to recognize that pollution within this industry stems from multiple sources. The incorporation of sustainable practices, despite their associated costs, is a paramount concern. The food retail industry’s ability to innovate and simultaneously reduce costs while improving product quality is of utmost importance. To address this challenge, business leaders must have access to accurate real-time data to uncover innovative opportunities.
In this fiercely competitive landscape, food retail companies are vying for market share and consumer loyalty. Managing data effectively becomes not just a strategic advantage but a necessity. The food industry is not only a significant contributor to climate change but also an attractive sector with numerous rivals. Accurate real-time data can serve as a critical differentiator, enabling companies to innovate swiftly and respond to rapidly changing customer demands. Moreover, safeguarding data from public access and competitors, while preserving customer privacy, is paramount. Our proposed data structure for transactions and Python algorithms align with our mission to empower decision-makers in the food retail industry to analyze data and formulate strategies that are both environmentally sustainable and financially profitable. Thus, our research delves into the quantitative aspects of the food retail industry, which is chosen as a context due to its complexity, sustainability challenges, and competitive nature. We believe that our methodology and proposed solutions will facilitate data-driven decision-making in this crucial sector, thus fostering innovation and contributing to a more sustainable future.
4. Data Management
Data are pivotal to a company’s success, serving as the bedrock of informed decision-making. Therefore, the accuracy and alignment of data with our mission are paramount. Moreover, it is imperative to grasp how to harness data effectively to maximize its utility and advantages.
4.1. Data Management Framework
The proposed data management framework is derived from the ‘DAMA’ body of knowledge, or DMBOK [27], named the Aiken pyramid (Figure 1), which helps guide business leaders determine the right data in line with their business strategy.
As can be seen from Figure 1, it is categorized into four different phases, which denotes that there is a specific sequence required to complete to achieve the outcome: real-time data mining and analytics using big data, although not every company in an industry needs big data to succeed, especially if the volume of data is not vast. It is vital for an industry that handles huge volumes of increasing products and transaction data like the food industry to implement best practices when managing data, which could be performed by using one of the data frameworks. For example, the Aiken pyramid (Figure 1) could lead to a successful implementation of business intelligence and quality data, which is paramount in the food industry, since it is an attractive industry and competition is intense. Thus, that would support decision-makers to maintain a dynamic competitive advantage [28] and implement our mission. The following explains each component within this framework:
- Data Governance: It administers data management and gives instructions by creating a system that includes decision rights over data that is defined by the enterprise.
- Data Architecture: It determines the plan and maintains data assets by aligning with the company’s overall strategy to establish strategic data details and designs that satisfy these details.
- Data Modeling and Design is the process of identifying, reviewing, describing, and conveying data details in a specific form called the data model.
- Data Storage and Operations: It includes the design, implementation, and direction of stored data to maximize its value. Moreover, the operations reinforce the data lifecycle from planning to disposal.
- Data Security: It guarantees that data security and confidentiality are correctly maintained, and that data can only be accessed by authorized people.
- Data Integration and Interoperability: It consists of the processes related to the direction and mixture of data within and between data stores, organizations, and applications.
- Document and Content Management: It involves managing different kinds of files and documentation that are important to the company, especially the legal and compliance documents.
- Reference: It involves the continuous reconciliation and maintenance of crucial and imperative shared data to make certain that data are consistent, accurate, relevant, and timely across the system of all business entities.
- Data Warehousing and Business Intelligence: It involves planning, implementing, and controlling processes of data that enforce decisions and make sure stakeholders are given value from data by reporting and interpreting.
- Metadata: It includes planning, implementing, and controlling activities to permit the attainability of integrated and high-quality metadata that involves description, models, data flows, and any other essential details to recognize systems and data.
- Data Quality: It consists of planning and implementing quality management techniques to assess, measure, and improve the appropriateness of required data within the organization.
4.2. Data Management Tools and Roles
It is important to acknowledge that technologies are continually evolving, and that the preference for a specific tool for a particular task is subject to change. Factors like cost and maintainability also come into play. Therefore, data experts should engage in regular evaluations of their tools, exploring newer, advanced alternatives that can deliver greater organizational benefits. However, it is crucial to note that each of the aforementioned components falls under the purview of specific roles, including data engineers, data analysts, data scientists, data architects, and more. These roles complement one another and operate without task overlap or conflicting expectations. Nowadays, there are many options to manage company data, which continues to advance. Below is an explanation of data management concepts from the oldest to the newest and a discussion of their advantages and challenges.
4.2.1. Data Mart
First, a data mart is stated by IBM [29] as a subdivision of a data warehouse focused on a unique line of business or department such as finance, marketing, sales, or HR (Figure 2). Moreover, this book [30] delineated concerns related to the use of data marts. To name a few: (1) inconsistency in managing data, which could lead to redundancy; (2) a data mart is considered unsustainable and not flexible to new changes, and as a result, it could waste money and time; (3) it is not dynamic and cannot adapt quickly to the customer’s needs. Therefore, a new data mart framework was introduced to address the previous issues, and it is named the ‘dynamic data mart implementation’ framework. Mainly, this framework prevents repetition and uses only one set of data pulled from one center. Additionally, the principles of this framework for handling data and reporting include 3 M, which are (1) data mining, (2) data marshaling, and (3) data meshing.
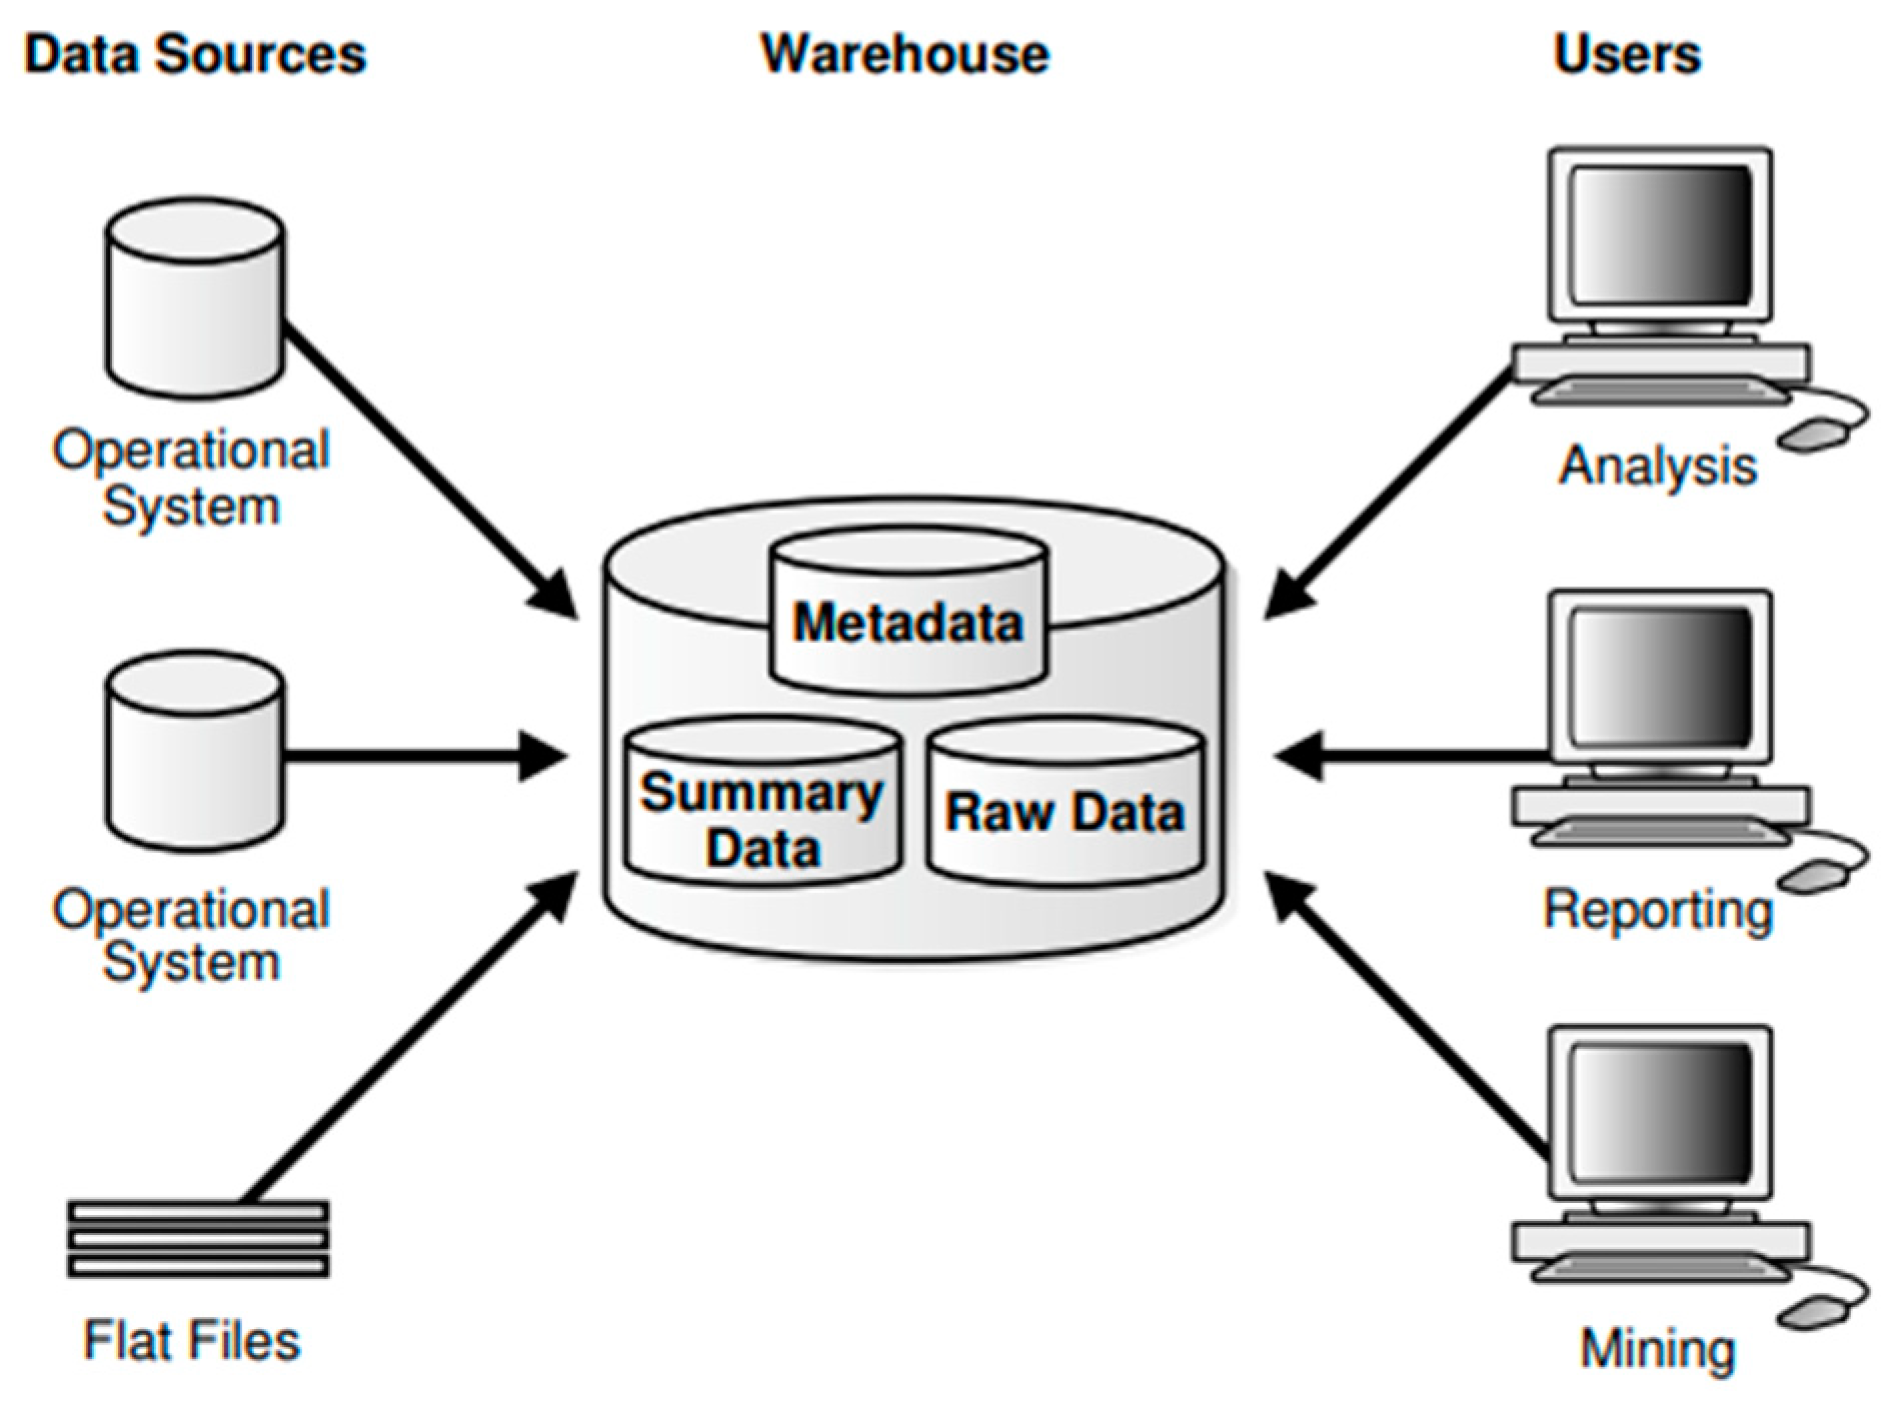
4.2.2. Data Warehouse
Second, the data warehouse is depicted by Oracle [31] (Figure 3) as the database generated to ease business intelligence activities that assist users in recognizing and enhancing their overall organization’s performance. Typically, it consists of historical data taken from transactional data, but it can also include data from different sources. In addition, it is crucial to discern the difference between the traditional data warehouse and the real-time data warehouse [32]. To elaborate, the traditional data warehouse can provide data only on a monthly, weekly, or daily basis, but is not updated instantly, unlike the real-time data warehouse, which could be preferable since it is more accurate and can enable both tactical and strategic decisions.
4.2.3. Data Lake
Third, a data lake is described in an article [33] as a centralized repository that allows users to store their data, whether it is unstructured or structured. Additionally, the research described in [34] claimed that application of a data lake can be challenging because of its variety and that the architecture of a data lake depends on the scenarios and how it is desired to be used. Further, the research suggested a framework (Figure 4) named DLAF, which is organized into nine clusters: (1) infrastructure, (2) data storage, (3) data flow, (4) data modeling, (5) data organization, (6) data processes, (7) metadata management, (8) data security and privacy, and (9) data quality.
4.2.4. The Future of Delta Lake
Finally, a delta lake was presented [35] as an initiated open-source project that established a lakehouse architecture above data lakes. In addition, recent research conducted by Stanford University [36] cited that the present common data warehouse architecture will disappear in the coming years and be replaced by another recent architectural pattern, which is known as the lakehouse. Moreover, there are four most common issues in today’s data architecture, which are (1) reliability—it can be costly and difficult to keep data consistent, which impacts data quality; (2) data staleness—data in the warehouse can take a long time to load; (3) insufficient maintenance for advanced analytics; and (4) it can be difficult to have direct access to data, and the cost of ownership is high. Subsequentially, the research clarified the solutions that lakehouse provides, which are (1) enhance the reliability of data management, which as a result improves the quality of data; (2) better support for data science and machine learning analysis; and (3) improved SQL performance, which is essential for swift analysis. Another recent study by Stanford University [37] stated that a delta lake has numerous advantages, such as refined overall performance, reduced costs, and decreased support issues.
4.3. Data Strategy and Culture
Surely, founding a data-driven company requires the right culture and environment to prosper, and that is supposed to be started by the top management, who must lead, support, and motivate their teams to learn about data and how to use it properly in a way that serves the company’s goals. For example, it can be performed by creating a business glossary that defines terms that can be used to measure a company’s performance. Moreover, data experts and business leaders must collaborate to align data strategy and business strategy and achieve meaningful results.
4.4. Data Analysis
In general, fostering a data-driven culture could lead to a better overall data strategy, which improves data quality as well. In addition, after learning about the data framework and its implementations, it is essential to select the best approach that suits the current capabilities of the company, such as its size, budget, resources, and overall goals.
5. Results
Chiefly, we want to examine the problem by bringing together the outcomes of three important issues that we deem to be the most valuable to our mission.
5.1. How Can We Strategically Use Customers’ Demand Data to Identify Ways to Reduce the Causes of Emission?
Firstly, we proposed a data structure that aligns with our mission (Figure 5), which is designed based on several attributes such as whether it is organic, plant-based, covered with a can or a jar, and if it needs any specific plastic-type, which is usually used to cover fresh food. In addition, we used the attribute ‘level of freshness’, which was introduced in previous research [23]. Also, three different levels indicate freshness. (1) The level is 1 if the difference between the creation date and the current date is less than 2 days. (2) The level is 2 if the difference is exactly between 2 and 5 days. (3) The level is 3 if the difference is more than 5 days. Moreover, we used two algorithms to answer this question and compared their results for better accuracy. The first algorithm, the CHAID algorithm [38], is used to find the relation between different classifications, discern patterns, visualize results, and categorize them based on their traits. The libraries used to implement this algorithm follow:
- CHAID: https://pypi.org/project/CHAID/ (accessed on 1 March 2023)
- Orca: https://pypi.org/project/orca/ (accessed on 1 March 2023)
- Graphviz: https://pypi.org/project/graphviz/ (accessed on 1 March 2023)
- Plotly: https://pypi.org/project/plotly/ (accessed on 1 March 2023)
- Pandas: https://pypi.org/project/pandas/ (accessed on 1 March 2023)
- Statsmodels: https://pypi.org/project/statsmodels/ (accessed on 1 March 2023)
Also, the stages to implement this algorithm follow:
- Import libraries and the data source;
- Data preparation with pandas;
- Transform and visualize numeric variables;
- Implement CHAID for each attribute (e.g., organic or plastic bag);
- Visualize and generate the decision-tree images.
After running the algorithm for each attribute, we obtained multiple decision trees that clarified some important insights. To summarize, the insights from each decision tree follow (Appendix A):
- Only 3.5% is organic meat and poultry, and if it is not in the meat and poultry category, then it is likely to use plastic bags, though it accounts for around 5%. This means that only a small percentage of customers buy organic food, and if they do not choose organic food, then it is likely that customers buy products that have plastic. Therefore, business leaders can prioritize promoting organic food (Figure A1).
- Only around 7% of purchased plant-based foods need plastic bags, and around 25% of purchases are not of meat and poultry products. This implies that business leaders can prioritize innovation to replace plastic used for plant-based food so that customers buy plant-based food that is completely environmentally friendly (Figure A2).
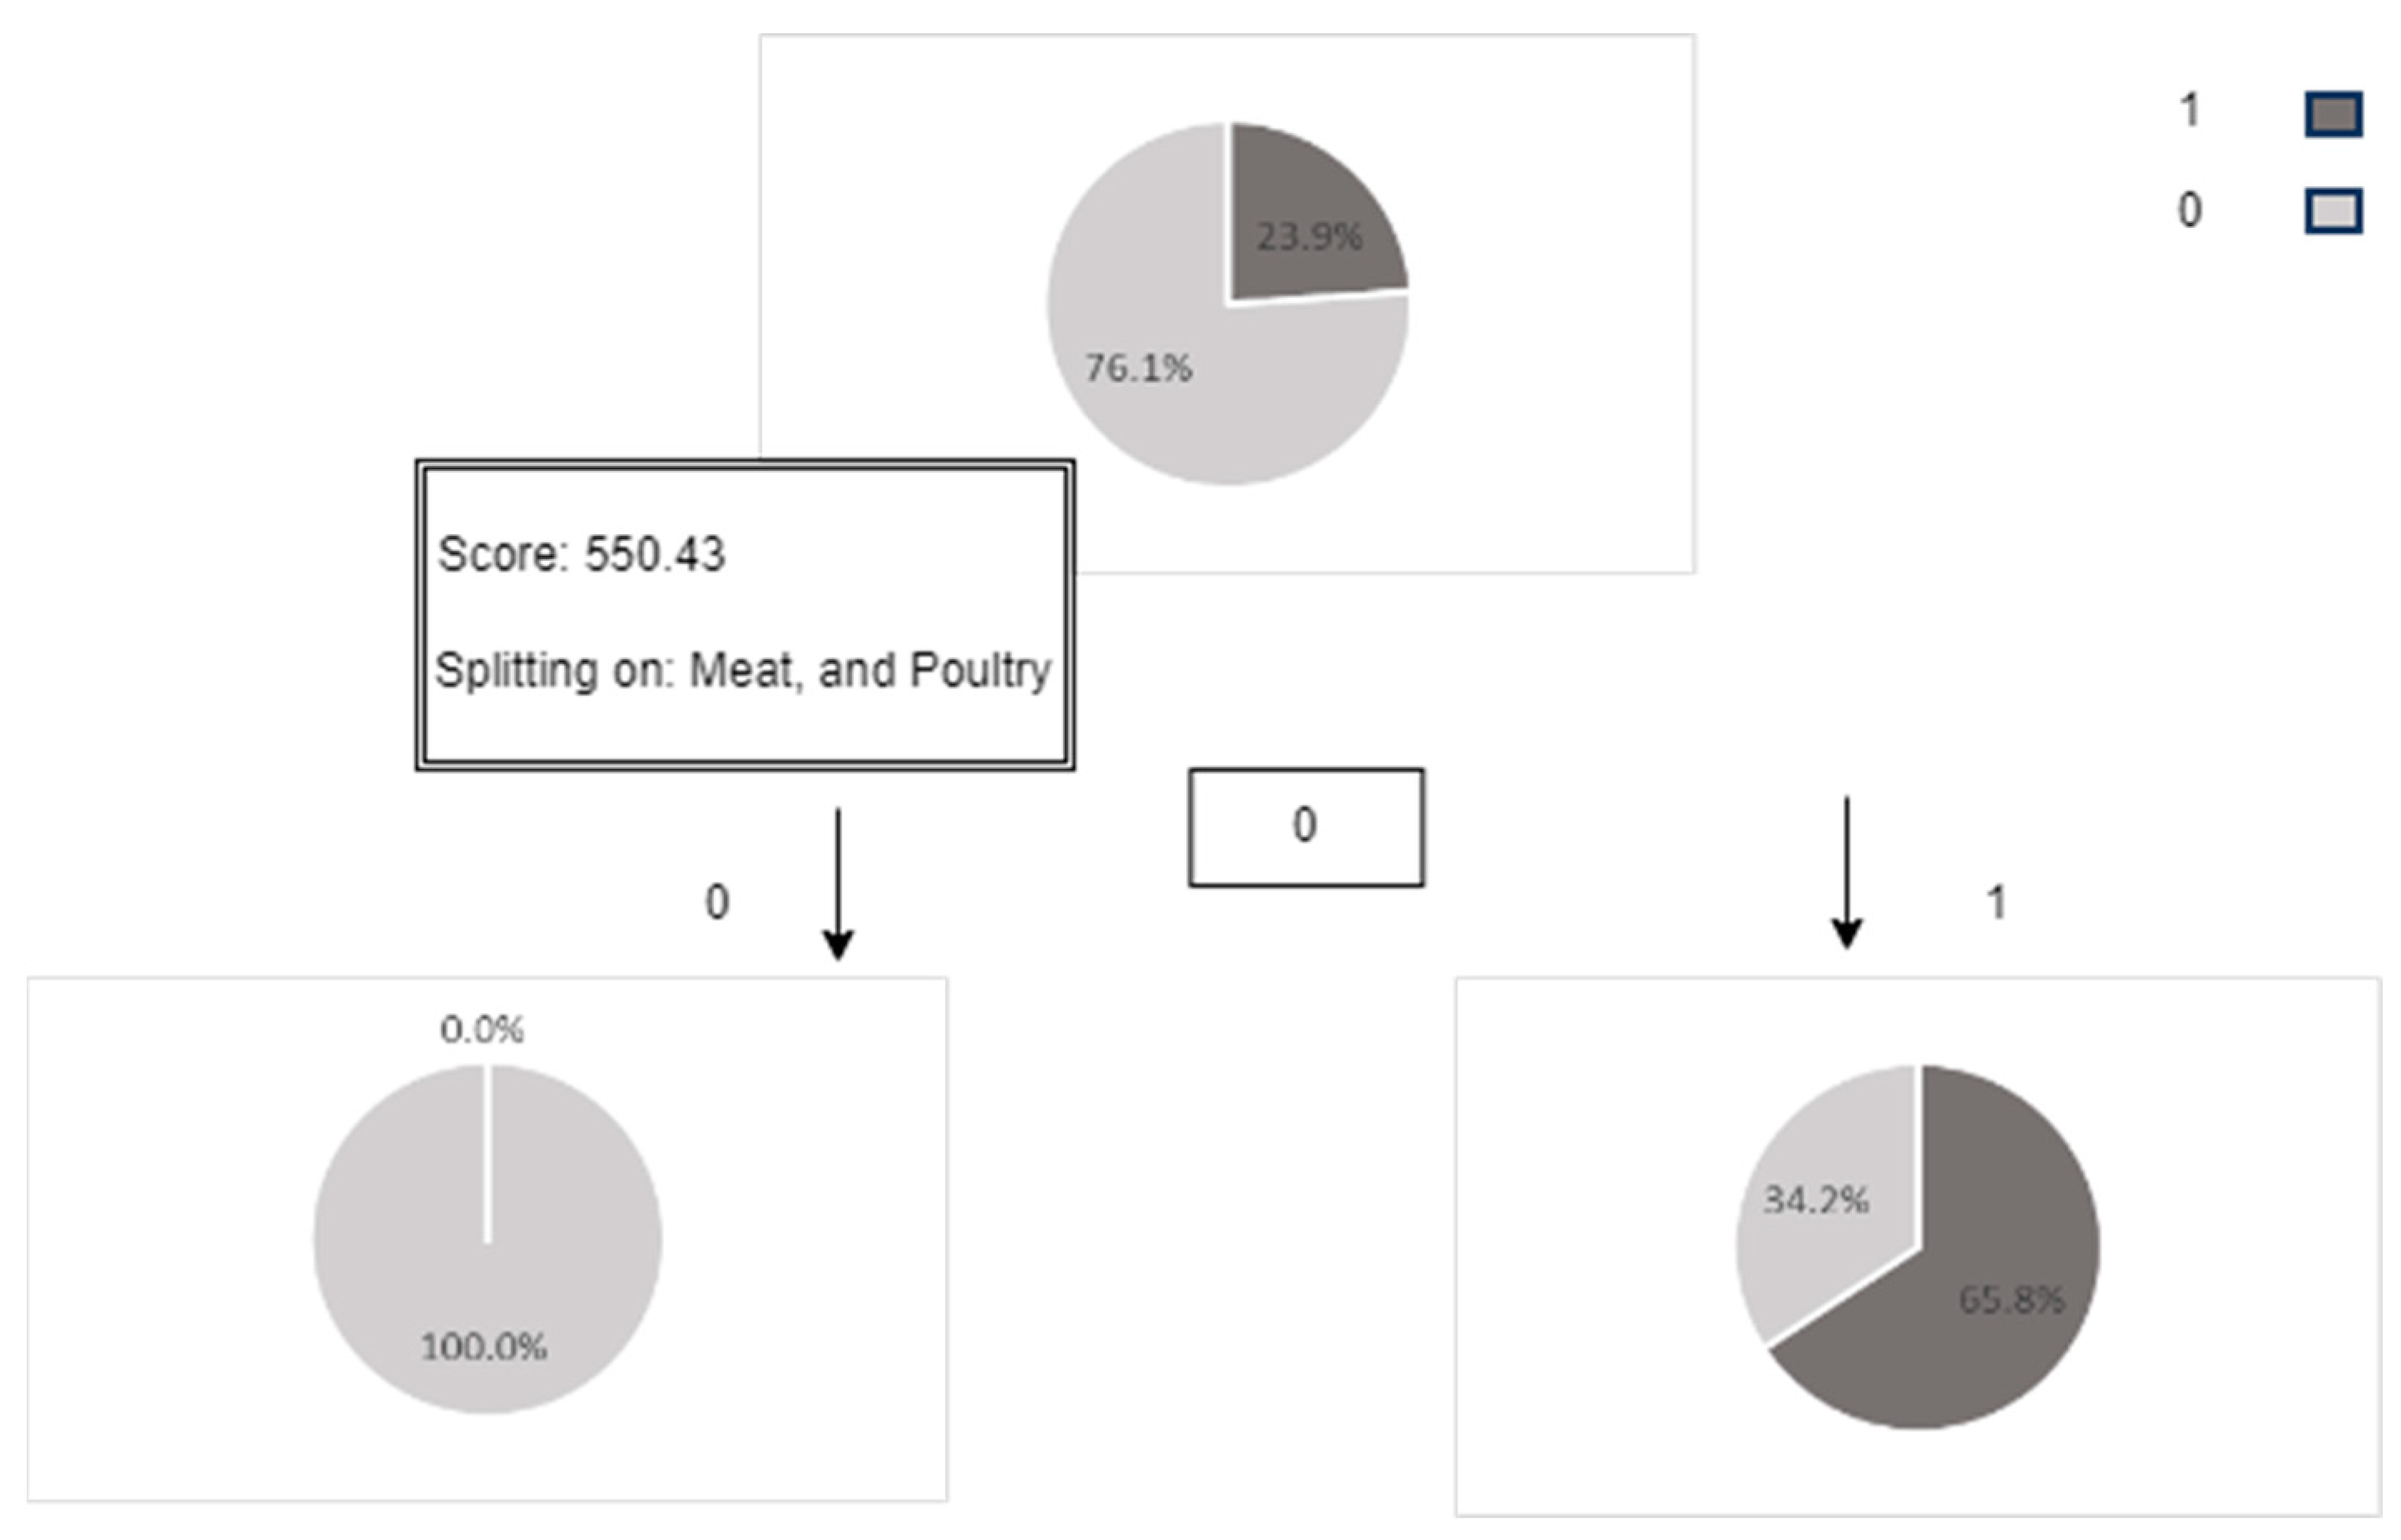
- More than 65% of the canned food purchased is meat or poultry products. This suggests that most purchased meat and poultry products are not fresh or sustainable. Hence, business leaders can explore means to innovate and replace the use of cans for meat and poultry products or start promoting fresh meat and poultry products (Figure A3).
- Products that use jars do not need plastic. However, around 33% of products purchased in jars are not meat and poultry products. This indicates that business leaders can concentrate on innovating substitutes for jars that are suitable for products other than meats, which could lessen the complexity of innovation and uncover possible ways to reduce costs (Figure A4).
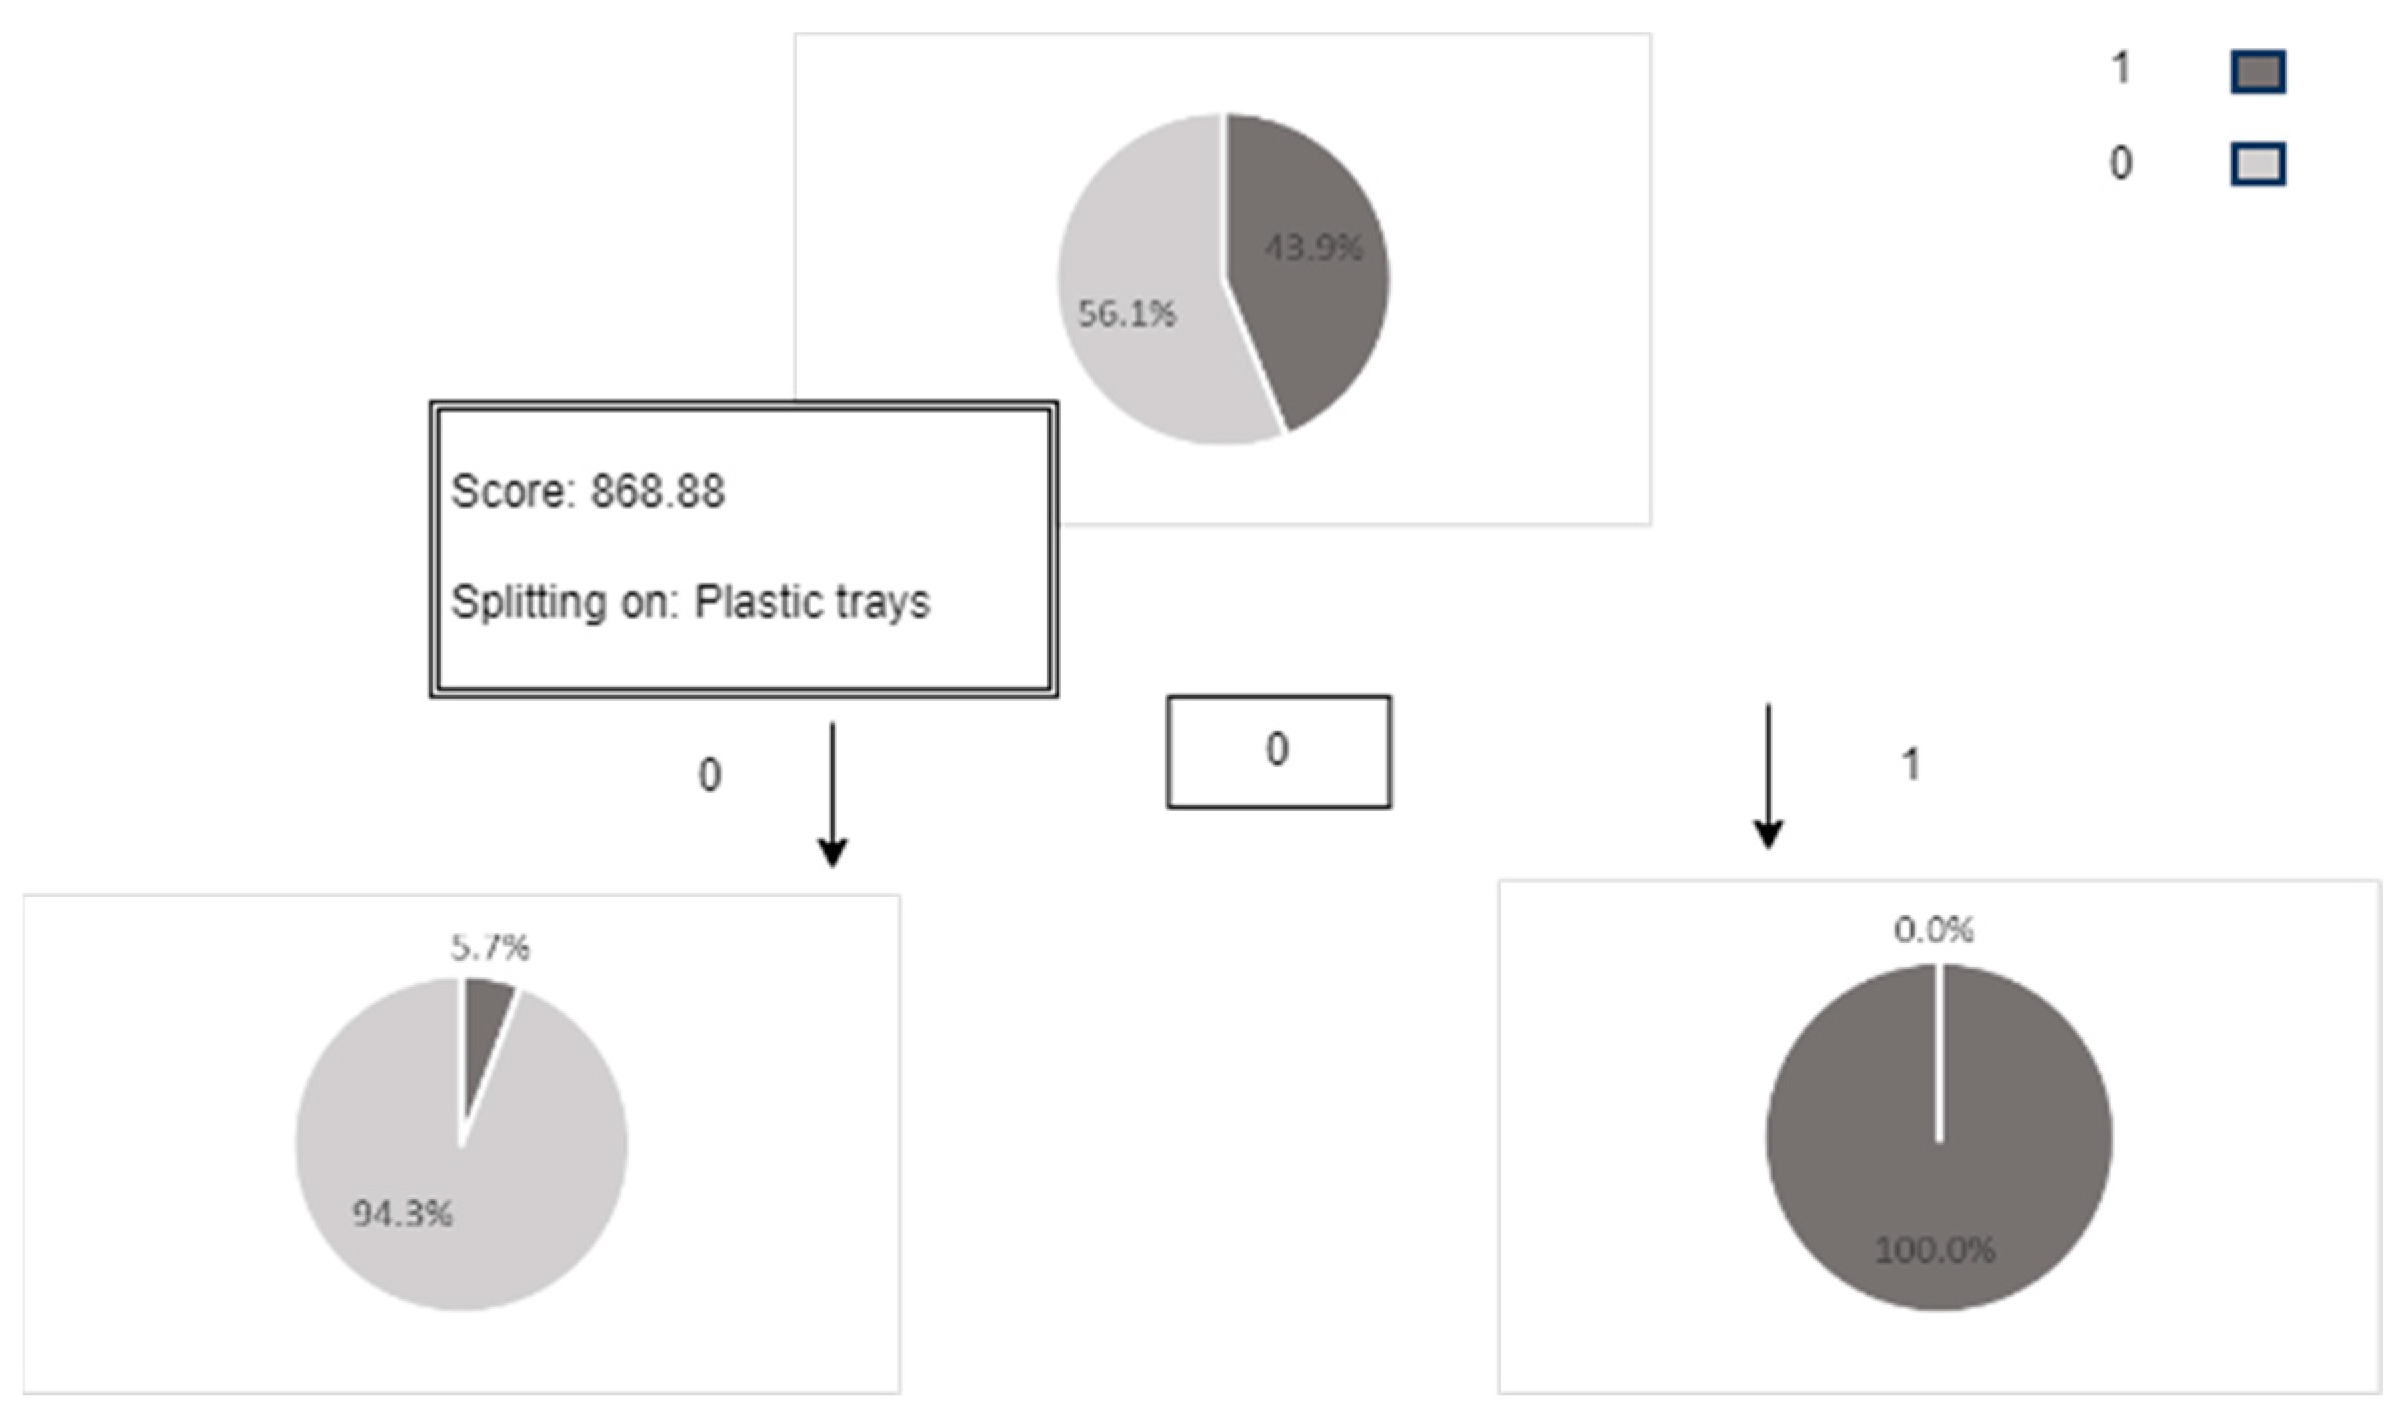
- Around 92% of purchased products that use plastic trays (e.g., fresh chicken trays) also need plastic covers. Obviously, the percentage of products bought that use plastic surpasses other materials. Therefore, business leaders can prioritize innovating materials that substitute plastic, which is cheaper and environmentally sustainable, while promoting fresh products that use plastic such as vegetables, fruits, and chicken, which are the most frequently purchased (Figure A5).
- Only 5% of purchased products that use plastic covers do not need plastic trays. This denotes that while the percentage of purchased products that need plastic is high, business leaders can prioritize exactly the type of plastic that needs to be replaced by more environmentally sustainable and cost-effective materials that would make the most impact sooner (Figure A6).
- Purchases that need plastic bags are likely to be fresh vegetables and fruits, and more than 97% of them also need plastic trays. However, if the purchase does not need plastic trays, then the quantity of the products is the reason for needing plastic bags. This re-emphasizes the previous interpretation that there is a correlation between buying fresh products and using lots of plastic bags, which again clarifies investing in research and innovation is valuable since it yields better sustainable solutions and more profits (Figure A7).
To summarize, now we can identify which contributes the most to pollution and which one should be optimized with innovation and investments.
The second algorithm is random forest, which is a popular machine-learning model [39] that is based on the concept of decision trees. Also, data marketers prefer this algorithm because it can be visualized. The libraries used to implement this algorithm follow:
- Pandas: https://pypi.org/project/pandas/ (accessed on 9 March 2023)
- SKlearn: https://pypi.org/project/sklearn3/ (accessed on 9 March 2023)
Also, the stages to implement this algorithm follow:
- Import libraries and the data source;
- Data preparation (removing transaction ID, or NAN) and transforming string variables;
- Isolate dependent and independent variables;
- Split data into testing and training sets;
- Implement the random forest;
- Test and train predictions and compare the means;
- Implement the confusion matrix;
- Visualize the last result with feature importance.
After applying this algorithm based on multiple attributes, we obtained meaningful insights that are summarized in Appendix B:
- Most of the organic food purchased is milk, and that quantity and level of freshness affect the purchases. This means that business leaders could concentrate on improving the freshness of milk (Figure A8).
- Most purchased plant-based products are also organic and milk products; the level of freshness can also affect purchases. Also, this points to the importance of improving the freshness of plant-based products when they are likely to be purchased (Figure A9).
- Most products that use cans are types of meat products; however, the level of freshness and quantity are drivers for purchasing such products. This implies that among products that use cans, meat is the most purchased, and hence business leaders can prioritize investing and reinventing sustainable and cost-effective cans for meat (Figure A10).
- Among the products that use jars, cheese is the most-purchased product, and that level of freshness and quantity are drivers of purchase decisions. This signifies that business leaders can first concentrate on reinventing jars of cheese among other products and improving its freshness since it is frequently purchased (Figure A11).
- Fruits and vegetables are the most common products that use plastic bags, covers, and trays. Again, this reassures us that innovating a new recyclable or reusable bag for fruits and vegetables that is also cost-effective can still yield abundant profits (Figure A12).
Briefly, we now can identify which types of products are frequently purchased, and as a result, we can decide which type of product is given priority for investment in research to innovate and transform into environmentally sustainable products.
5.2. How Can We Use Data to Implement an Environmentally Sustainable Solution to Reduce Emissions and Sustain Our Competitive Advantage?
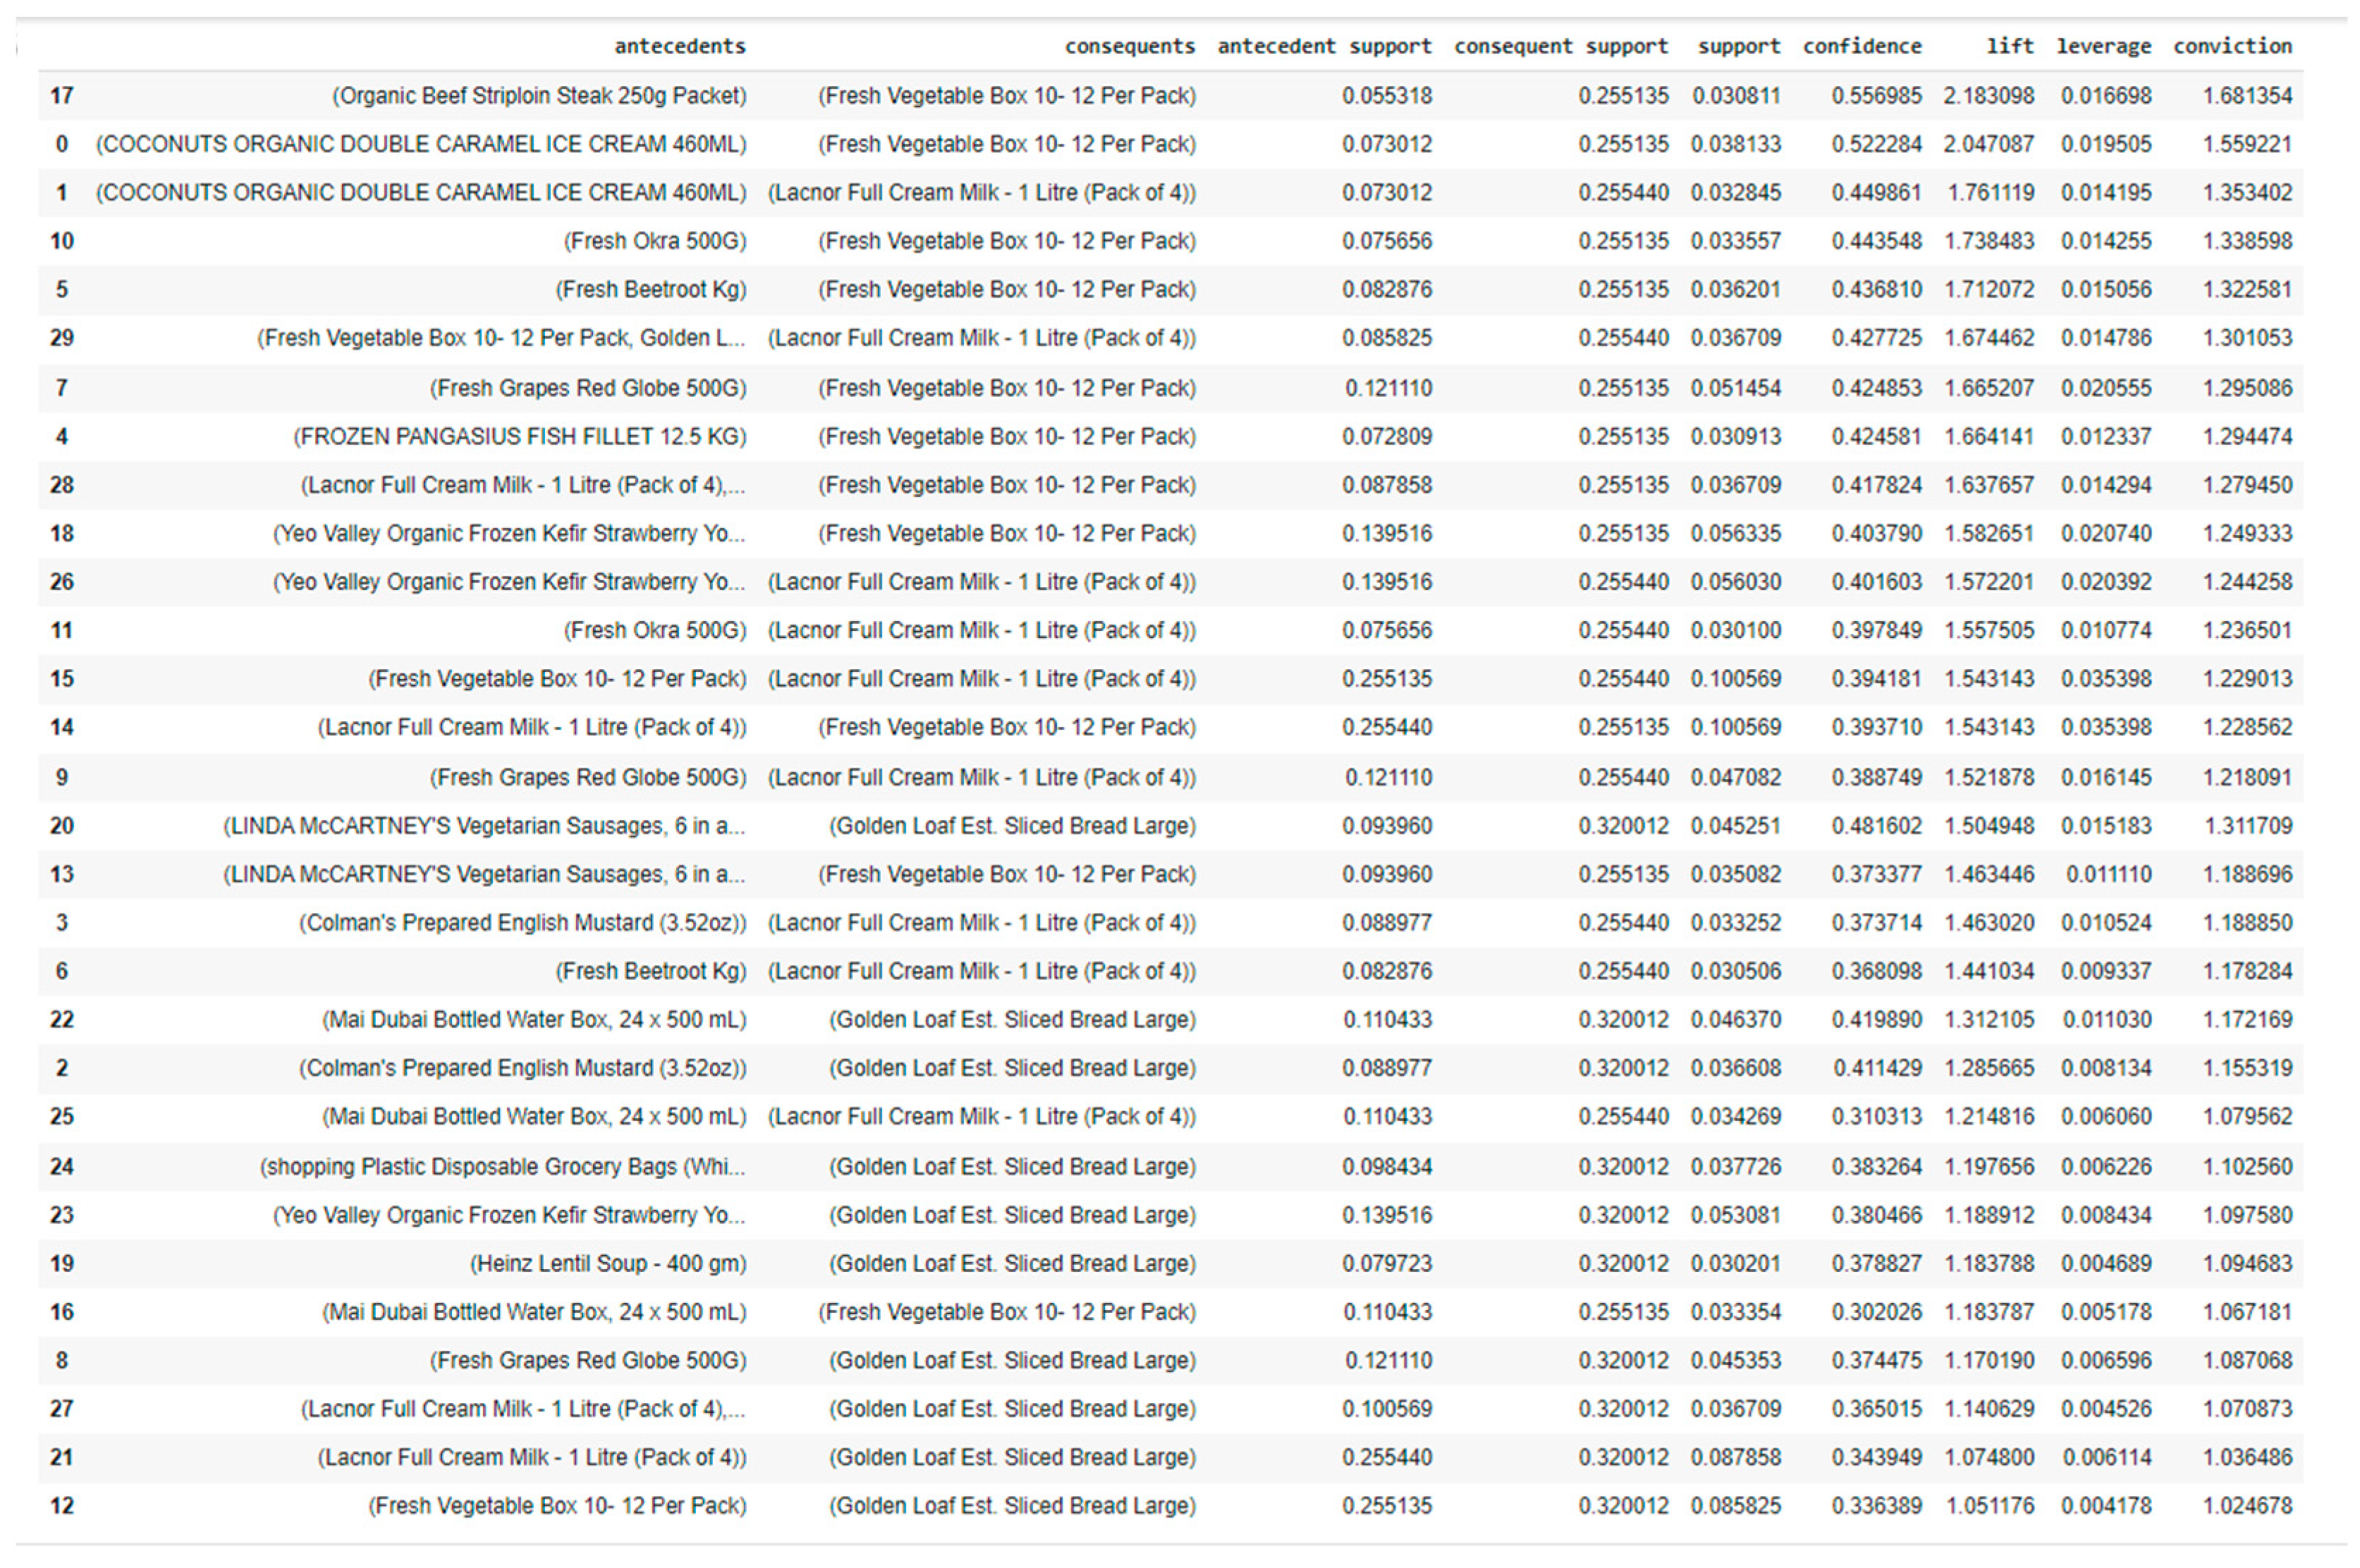
Next, the apriori/association rule algorithm was used, and it is depicted [40] as one kind of recommendation system. It takes recurring items in the search hierarchy in an iterative form, and it stops when there is nothing new. Figure 6 is an example of the data structure of product transactions. Figure 7 illustrates the used libraries, and Figure 8 is the result after applying the Apriori Algorithm. The libraries used to implement this algorithm follow:
- Pandas: https://pypi.org/project/pandas/ (accessed on 12 March 2023)
- Mlxtend: https://pypi.org/project/mlxtend/ (accessed on 12 March 2023)
- Matplotlib: https://pypi.org/project/matplotlib/ (accessed on 12 March 2023)
Also, the stages taken to implement this algorithm follow:
- Import libraries and the data source;
- Iterate through the transactions list;
- Encode the transactions;
- Implement apriori and association rules;
- Visualize graphs.
This algorithm uses three different mathematical formulas, which follow:
- Support formula, where X is a product, and we calculate the relevance and support of each type of product among all transactions, and the formula is written as:
Support(X) = #Transactions with X/Total Transactions
- 2.
- Confidence formula, where X and Y are both considered two different types of products and the formula is used to specify the relationship strength between two different products; the formula is written as:
Confidence(Y|X) = # Transactions with X and Y/Total X Transactions
- 3.
- Lift formula, which uses both the support and confidence formulas. It calculates the likelihood of purchasing products X and Y at once versus purchasing product X alone, and if the result is more than 1, then the probability increases, the formula is
Lift(Y|X) = Confidence(Y|X)/Support(Y)
After running the algorithm, we received numerous results, which are illustrated below.
In Figure 8, we can take an example, which is ID 17. The first product is ‘The Organic Beef Striploin Steak 250g Packet’, and the second is ‘The Fresh Vegetable Box 10–12 Per Pack’, and the support is (0.03 × 100) = 3%, and there is around 56% confidence that both products will be bought together. The final lift is 2.18, which is more than 1, and that means that the likelihood of buying both products is high. In addition, we can see the results in Figure 9.
Once again, the graph shows us that the record with ID 17 is more than 0.55 (confidence line) and around 0.03 (support line), which means that even though both products may not often be purchased, the chances of them being bought together are high.
In conclusion, the purpose in using this algorithm is to increase the number of products in customers’ ‘baskets’. For that reason, business leaders should identify environmentally sustainable products that can be promoted, such as plant-based or organic products. In addition, they can improve the freshness of products that are purchased frequently.
5.3. Based on Our Data, How Can We Use Machine Learning to Create More Accurate and Insightful Reports to Help Decision-Makers?
Finally, we used Facebook Prophet to forecast the demand for products based on previous transactions (Figure 10). It is defined in Facebook Meta [41] as an open-source project, which means developers around the world can contribute to this project, and it is a forecasting tool that can use programming languages such as R or Python for data science. Moreover, it was clarified that this tool is useful for planning capacity, assigning inadequate resources effectively, and setting goals that measure actual performance against the baseline. The libraries used to implement this algorithm follow:
- Prophet: https://pypi.org/project/prophet/ (accessed on 23 March 2023)
- Pystan (2.14): https://pypi.org/project/pystan/ (accessed on 23 March 2023)
- Fbprophet: https://pypi.org/project/fbprophet/ (accessed on 23 March 2023)
- Itertools: https://pypi.org/project/aioitertools/ (accessed on 23 March 2023)
- Numpy: https://pypi.org/project/numpy/ (accessed on 23 March 2023)
- Pandas: https://pypi.org/project/pandas/ (accessed on 23 March 2023)
Also, the stages to implement this algorithm follow:
- Import libraries and the data source;
- Select variables;
- Data transformation;
- Split training and test sets;
- Implement Facebook Prophet;
- Forecast final results;
- Visualize forecast results;
- Perform model assessment with MAE (mean absolute error), and MAPE functions;
- Carry out diagnosis and cross-validation (ex: days horizon: 31 days);
- Perform an assessment with MAE and RMSE (mean squared error);
- Perform hyperparameter tuning;
- Execute the final Prophet model;
- Forecast final results;
- Export final forecast results.
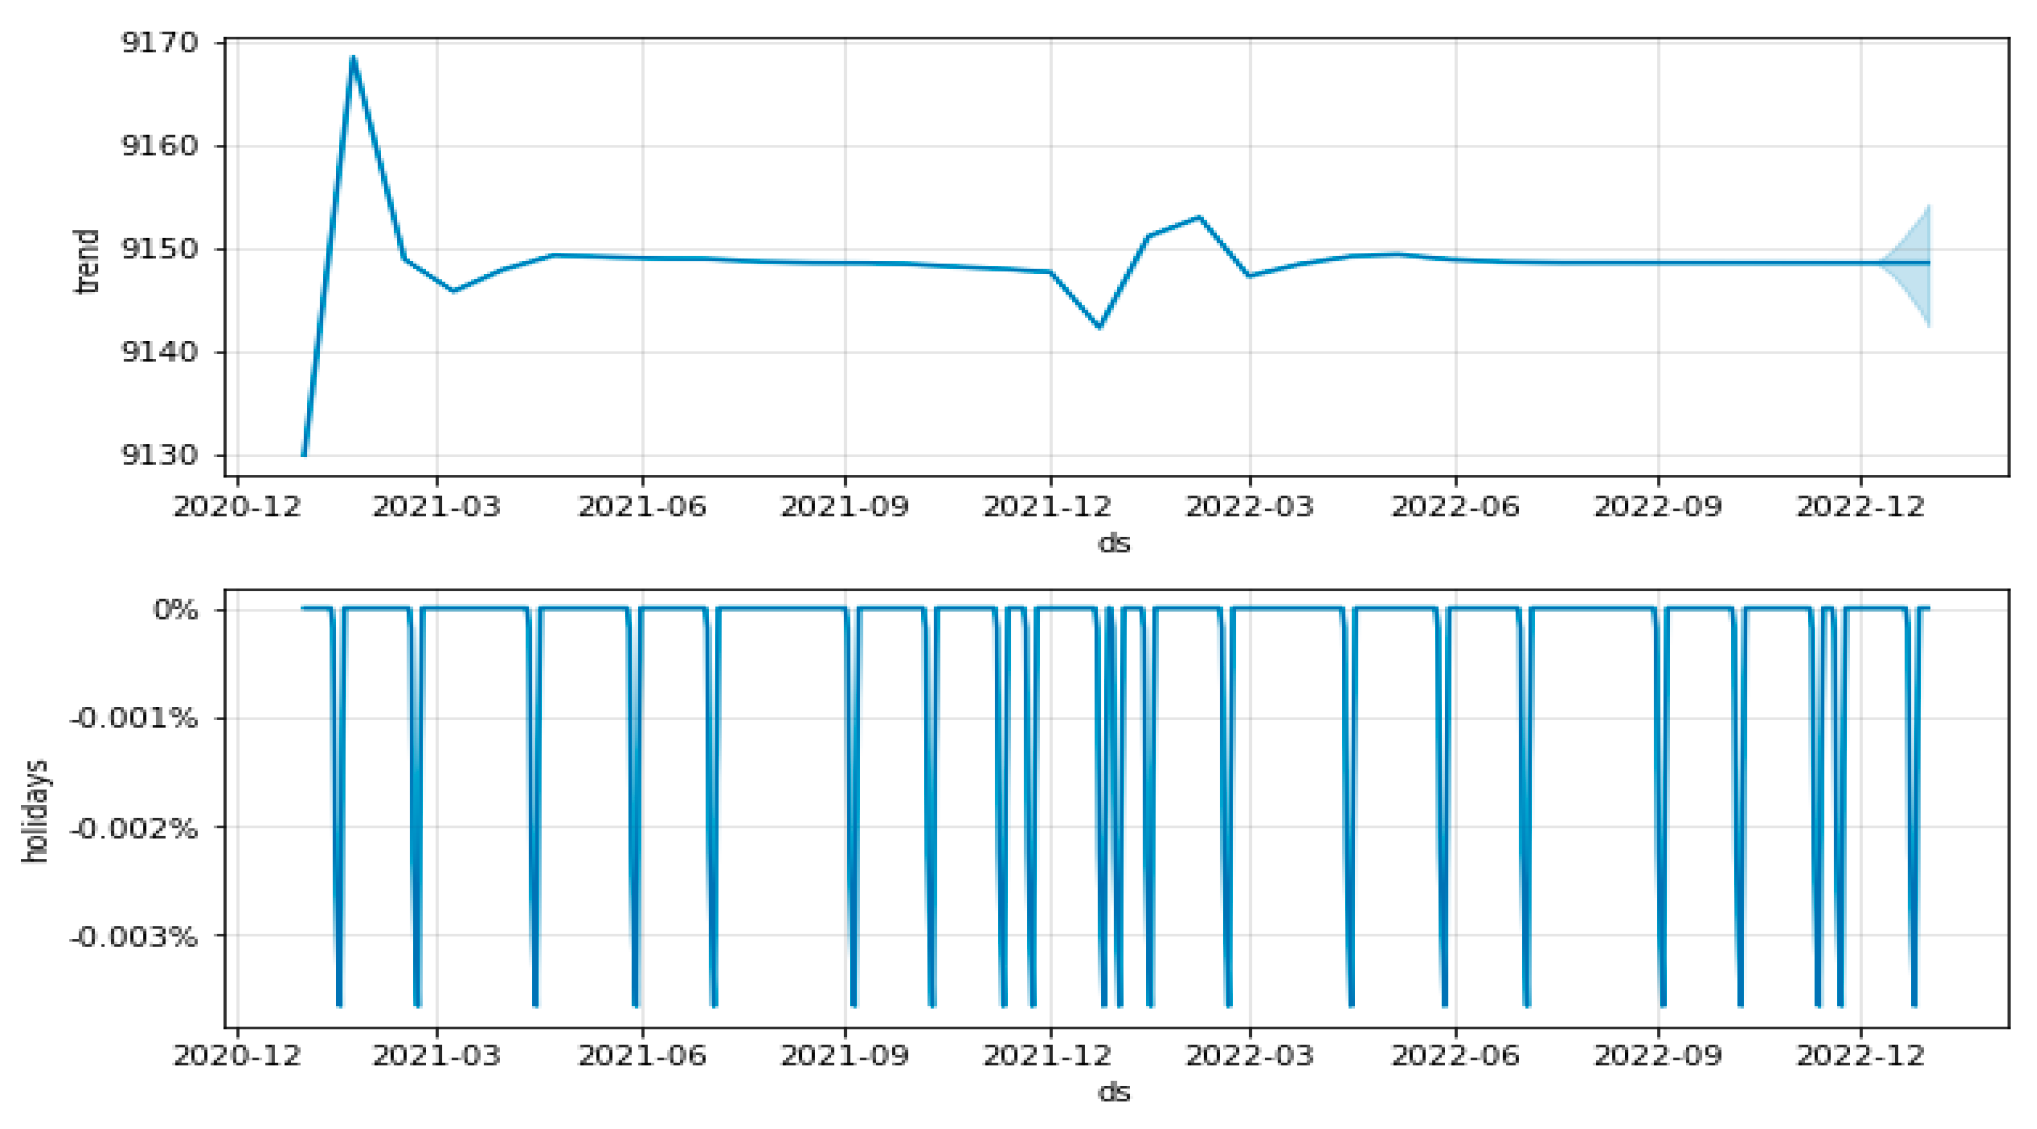
Figure 11 displays an example of the data structure of transaction records in 2021, and 2022. Moreover, the results show four plots of the holidays, weekly, yearly, and overall trends.
In the first trend plot (Figure 11), there is a significant spike at the beginning of the year, which means that customers are likely to buy more products during this period, and then it remains at the same level until the end of the year. Next, the second plot illustrates that during specific dates, people tend to buy more during holidays.
In the weekly plot (Figure 12), we can see that there is an increase in transactions when the weekend approaches and it decreases regularly during weekdays. After that, the yearly plot displays that the number of transactions rose in December and January, and then dramatically declined in February. After that, it again augments and then stays at nearly the same level throughout the year.
Finally, another algorithm, XGBoost [42], is used to compare the results with Facebook Prophet. The abbreviation of XGBoost stands for extreme gradient boosting, and it has many benefits such as model performance and fast execution. To compare the accuracy of each algorithm, we calculated MAPE (mean absolute percentage error), the results of which is presented in Figure 13 and Figure 14. The difference is small, and that indicates the average error between the predicted and actual results is low. The libraries used to implement this algorithm follow:
- Prophet: https://pypi.org/project/prophet/ (accessed on 24 March 2023)
- Pystan (2.14): https://pypi.org/project/pystan/ (accessed on 24 March 2023)
- Fbprophet: https://pypi.org/project/fbprophet/ (accessed on 24 March 2023)
- XGBoost: https://pypi.org/project/xgboost/ (accessed on 24 March 2023)
- Itertools: https://pypi.org/project/aioitertools/ (accessed on 24 March 2023)
- Pandas: https://pypi.org/project/pandas/ (accessed on 24 March 2023)
- Numpy: https://pypi.org/project/numpy/ (accessed on 24 March 2023)
Also, the stages to implement this algorithm follow:
- Import libraries and the data source;
- Select variables;
- Data transformation;
- Split training and test sets;
- Implement Facebook Prophet;
- Prepare and run XGBoost;
- Perform forecast and final visualization;
- Carry out the model assessment;
- Export forecast results.
Afterward, the result of prediction using this algorithm with the previous data structure is shown in Figure 15.
Figure 15 displays a blue line (the training set), and orange lines overlap (the test set) which indicates that they produce similar results. Next, the blue line that represents real historical data, and the green is the forecasted data; it shows that at the end of the year, there is an increase and then it dramatically decreases. Overall, the two algorithms show similar trends, and that could help business leaders use trends to make better strategic decisions based on their current data, be able to be dynamic, and uncover more opportunities. Notably, if company data are used strategically, then it is one of the most important capabilities. Therefore, the company should regularly develop its data capabilities by staying informed with the latest technology and developing team skills. Further, it is stated that companies [43] that aim to innovate and grow sustainability should intelligently use information to merge both efficiency and creativity, which are crucial for long-term competitive advantage, with unique strategies that provide high-quality services. Another source [44] emphasized that companies could produce strategic innovation systems that discover radical innovation and integrate the progression of incremental innovation that depends on radical innovation. Thus, data management and development can lead companies toward sustainable innovation that sets them ahead of the competition by creating a system. Finally, other studies [45,46,47,48] discussed the relationship between dynamic capabilities and innovative business models. In order to create value, a company either develops it internally or acquires external companies to upgrade their services. An example can be seen from customers’ purchase trends; a company can acquire other business to provide fresher food, at the right time, to reduce food wastage.
5.4. Business Intelligence Report Dashboards
Nowadays, business intelligence has become an important tool that can help decision-makers, and more companies are incorporating it into their reporting practices. It is mentioned in an eBook [49] that aggregated advice from top data and business leaders worldwide. The founder of Rapyid.ai emphasized the importance of understanding how AI works before using business intelligence tools because, without adequate knowledge, business leaders might misinterpret the relationship between business intelligence and AI. As a result, they will be unable to reap the benefits of using business intelligence tools. Going further, he explained that business intelligence is used to collect data and transform it into visualization to simplify analyzing business reports. To name a few, Tableau and PowerBI are types of business intelligence tools. In this section, we used Tableau to create two different dashboards using the same data from previous answers.
5.4.1. Dashboard 1 Interpretation
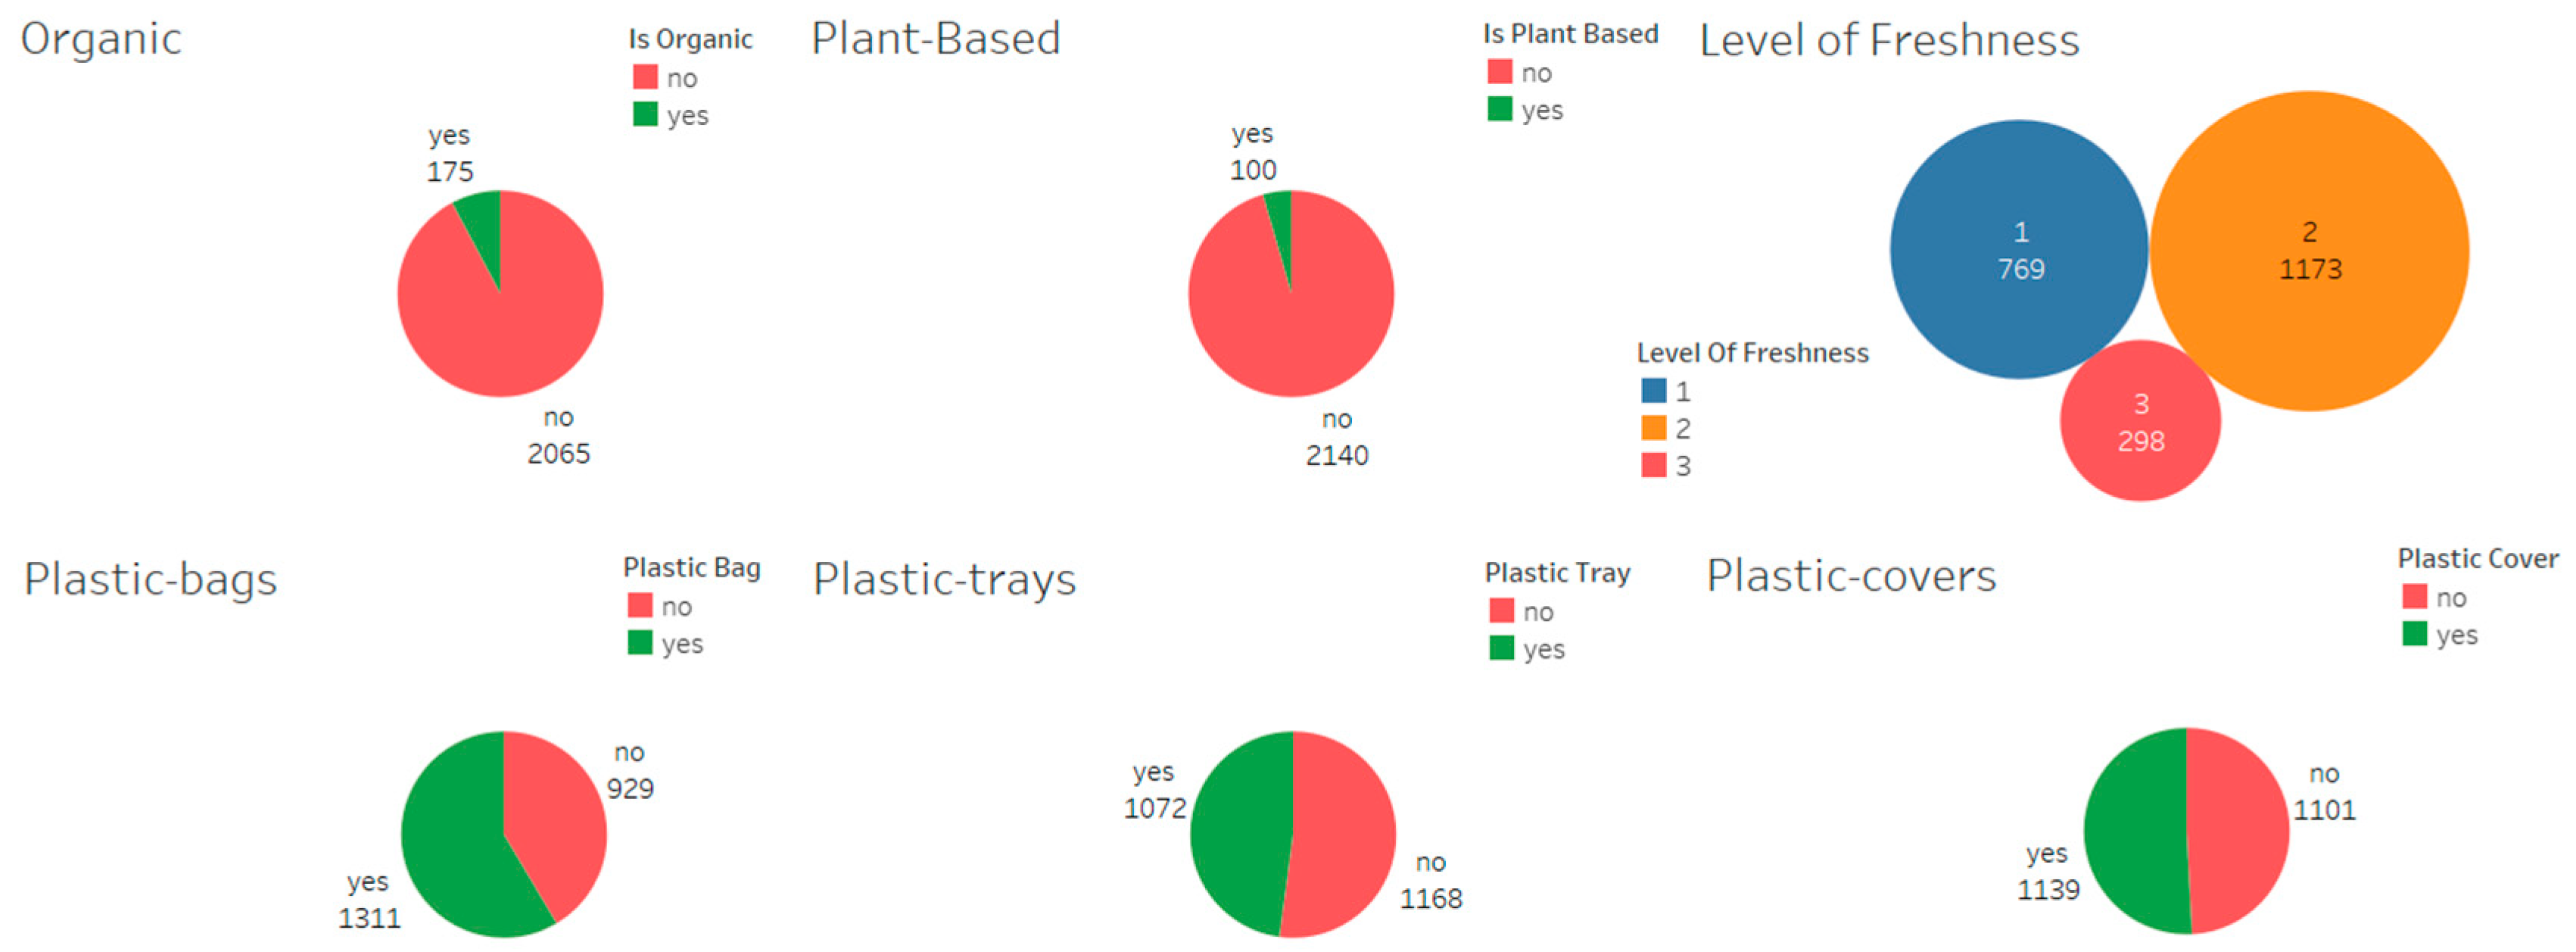
In the first dashboard (Figure 16), the pie charts colored in red and green denote the number of purchased products in 2022 and 2021 for each attribute discussed earlier, which are organic, plant-based, plastic bags, trays, and covers. The number of organic, and plant-based food bought is small compared to other kinds of food. In addition, plastic bags and covers are the most-used plastic. Next, the level of freshness pie chart indicates that most purchased food is not fresh, because most transactions had level 2 for freshness. These results reveal important implications for business leaders, such as:
- Generally, environmentally sustainable products such as organic and plant-based are not being promoted enough, which could result in less demand due to high costs. Thus, business leaders should innovate to reduce the costs associated with creating these products and improve their visibility so that they create more demand and balance their costs to become affordable to customers, compared to nonsustainable products.
- It seems that frequently purchased products use plastic bags and covers, which means that business leaders must prioritize reinventing plastic used with these products over other products, because of their high demand.
- Finally, it seems that most of the purchased products are not the freshest since they are in the level 2 category, which could lead to a shorter time to consume these products, or the food will be wasted. Hence, business leaders should improve customer experience by organizing their operations to provide fresh food based on the customer’s time of purchase, which can be achieved by merging or acquiring companies that complement and improve this part of the business.
5.4.2. Dashboard 2 Interpretation
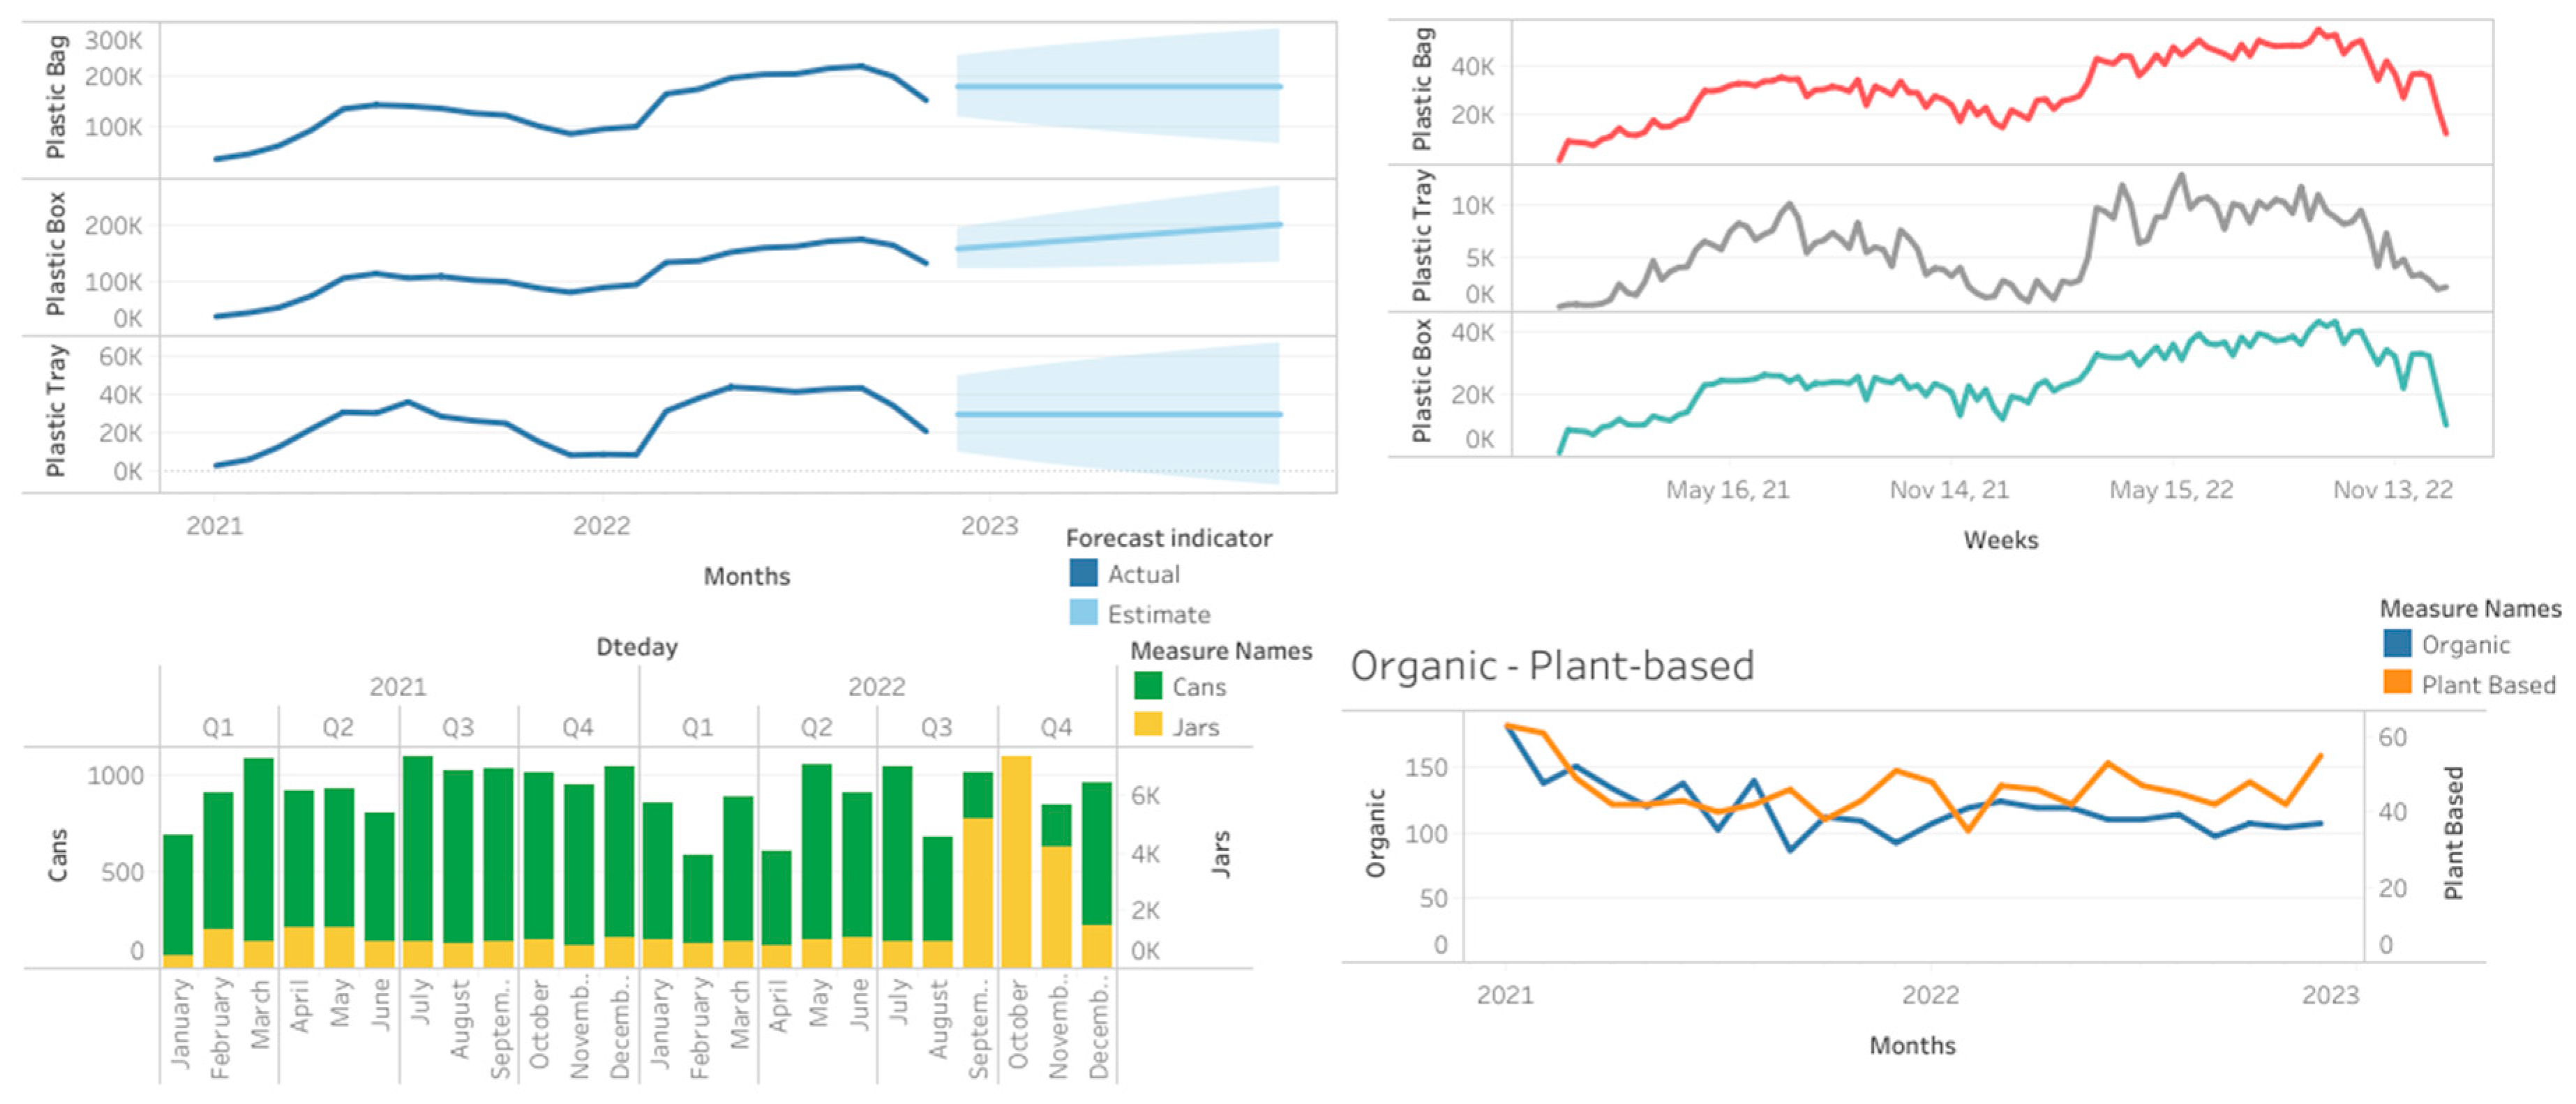
In the second dashboard (Figure 17), the first line chart illustrates the number of used plastics that are categorized. The chart shows a prediction of how much it is likely to be used in the future, based on historical transactions in 2021 and 2022. Similarly, the next line chart shows the number of used plastics every week. After that, the bar chart displays the number of products bought that use cans, such as preserved meat, is more than jars. Finally, the last line chart shows that people are buying plant-based food more often than organic. These inferences indicate that:
- Since the prediction clarifies that customers will continue to buy products that use this type of plastic in large quantities, business leaders can be more confident to invest in innovative solution research to replace the use of plastic with sustainable materials,.
- Next, business leaders can prioritize innovating to replace cans rather than jars now, because of the high demand that means the positive impact will be higher and faster.
- Finally, business leaders should investigate further why customers favor plant-based over organic food and improve the quality, costs, and promotion for both types of products.
Nowadays, many supermarkets and grocery advocate for sustainability, which was implemented by applying fees for each purchased plastic bag at the counter, so that customers would be motivated to buy sustainable bags even though they can be more expensive than the common plastic bags, but can be reused and are usually tougher. However, that is not sufficient in order to be truly and completely sustainable. In the end, the customers buy many products that are not designed to be sustainable or not even sustainable by nature. For instance, organic vegetables might be more sustainable but in reality, the vegetables are covered with plastic. Another example is that common milk is usually promoted more than plant-based milk, though plant-based milk is more sustainable and could be healthier.
6. Discussion and Conclusions
It is vital to understand the interconnection between social, economic, and environmental concepts [2] in the strategy of an organization since that can lead to sustainable innovations, which can be expanded to different aspects such as technology, operations, product design, and development—important factors in a sustainable and successful company. By embracing the principles of design thinking, this study sets forth a strategic framework that not only allows us to comprehend the evolving needs of our customers but also enhances their overall experience while optimizing operational efficiency. This customer-centric process has not only fostered innovation but also positioned us as solution providers in a dynamic marketplace. Furthermore, it is imperative for business leaders to conduct a rigorous internal analysis of their organization, with a particular emphasis on cultivating a data-driven culture. This culture serves as the cornerstone for fostering experimentation, continuous learning, and innovation, laying a robust foundation for sustained growth and adaptability. In addition, incorporating purpose-driven CSR programs is a strategic approach for companies to reinforce their organizational culture. These initiatives are committed to social and environmental causes that align with the company’s values and mission. By actively engaging employees in these programs, companies instill a shared sense of purpose and social consciousness. This enhances job satisfaction, morale, and employee loyalty. Additionally, CSR programs promote teamwork and unity among employees, fostering a positive work environment. They also improve the company’s external reputation, attracting socially conscious consumers and partners. In essence, purpose-driven CSR initiatives serve as a powerful means to align organizational values with societal and environmental goals. This explanation is a unique composition and does not borrow content from any existing source. As we navigate the ever-changing business landscape, remaining vigilant for potential opportunities and threats is essential. Strategically positioning our organizations to harness these opportunities and effectively mitigate threats is a pivotal task in ensuring our long-term success. With these strategic foundations in place, business leaders can confidently proceed to reconfigure and refine product offerings, align them with our strategic vision, and execute chosen strategies effectively. This strategic execution represents the culmination of our efforts, ultimately aimed at achieving and sustaining a competitive advantage in the market [46,47,48,50]. It is clear that the effective use of quality data is paramount for business executives. Aligning data strategy with the overall business strategy is not merely an option but a necessity. This alignment can only be achieved when every member within the organization takes ownership and collaborates to ensure data accuracy and consistency.
Our study can be extended by delving into the granular applications of data science in the pursuit of sustainability. This could encompass innovative approaches to reduce operational costs related to electricity consumption, inventory management, and food transportation. Furthermore, while the current study clarifies the potential of data science for sustainability within Amazon’s online retail platform, it is imperative to acknowledge the inherent limitations and chart future research directions. The study’s scope is inherently confined to a specific platform, potentially limiting the generalizability of findings to diverse retail environments. Therefore, there is a pressing need for further research to explore the applicability and effectiveness of data-driven sustainability initiatives across a range of industries [49,51,52,53]. Ethical and security concerns surrounding data privacy necessitate a rigorous examination, particularly in the context of collecting and utilizing substantial datasets for sustainability efforts [53]. Long-term impact assessments of data-driven sustainability initiatives on businesses and the environment require dedicated research efforts to unveil the full spectrum of effects. Amazon was chosen as the online source for this research primarily to compare its product availability with local alternatives. However, it is important to note that from a technical perspective, Amazon also offers a range of data management services, including data warehousing and data mining. These services are part of Amazon Web Services (AWS), a cloud platform that is widely recognized for its capabilities. It is worth mentioning that other cloud service providers, such as Google Cloud and Microsoft Azure, offer similar data management services, each with their own unique features and characteristics. While we acknowledge that these providers have their strengths and may be preferred by some businesses depending on specific requirements, it is essential to recognize that Amazon’s AWS is renowned for its extensive suite of services and robust infrastructure, making it a popular choice for many organizations. Future research should also endeavor to establish standardized sustainability metrics, investigate consumer behaviors influenced by data-driven sustainability strategies, and scrutinize the role of government regulations and policies in shaping corporate sustainability practices. International and cross-industry studies hold the potential to provide a more comprehensive understanding of the global implications in data-driven sustainability efforts.
Author Contributions
The authors contribute equally to the paper’s theoretical and empirical parts. All authors have read and agreed to the published version of the manuscript.
Funding
This research received no external funding.
Institutional Review Board Statement
Not applicable.
Informed Consent Statement
Not applicable.
Data Availability Statement
Data are contained within the article.
Conflicts of Interest
The authors declare no conflict of interest.
Appendix A. CHAID Algorithm Decision-Tree Results
Figure A1.
Organic food—CHAID algorithm.

Figure A2.
Plant-based food—CHAID algorithm.

Figure A3.
Canned food—CHAID algorithm.

Figure A4.
Jarred food—CHAID algorithm.

Figure A5.
Plastic covers—CHAID algorithm.

Figure A6.
Plastic trays—CHAID algorithm.

Figure A7.
Plastic bags—CHAID algorithm.


Table A1.
Figure A1 details—organic food.
Table A1.
Figure A1 details—organic food.
| Items | Score | 0 (Negative) | 1 (Positive) |
|---|---|---|---|
| Organic food | 27.92 | 89.7% | 10.3% |
| Organic meat or poultry | 0 | 96.4% | 3.6% |
| Not meat or poultry and organic product | 51.99 | 85.8% | 14.2% |
| Organic food that needs plastic bags | 0 | 94.9% | 5.1% |
| Organic food that does not need plastic bags | 0 | 74.8% | 25.2% |
Table A2.
Figure A2 details—plant-based food.
Table A2.
Figure A2 details—plant-based food.
| Items | Score | 0 (Negative) | 1 (Positive) |
|---|---|---|---|
| Plant-based food | 60.18 | 92.7% | 7.3% |
| Plant-based food that needs plastic bags | 0 | 99.8% | 0.2% |
| Plant-based food that does not need plastic bags | 76.74 | 86.9% | 13.1% |
| Plant-based food, and is meat or poultry | 0 | 100% | 0% |
| Plant-based, and is not meat, or poultry | 0 | 74.8% | 25.2% |
Table A3.
Figure A3 details—canned food.
Table A3.
Figure A3 details—canned food.
| Items | Score | 0 (Negative) | 1 (Positive) |
|---|---|---|---|
| Food that needs cans | 550.43 | 76.1% | 23.9% |
| Food that needs cans, and could be meat, or poultry | 0 | 34.2% | 65.8% |
| Food that needs cans, and is not meat, or poultry | 0 | 100% | 0% |
Table A4.
Figure A4 details—jarred food.
Table A4.
Figure A4 details—jarred food.
| Items | Score | 0 (Negative) | 1 (Positive) |
|---|---|---|---|
| Food that needs jars | 85.36 | 90.5% | 9.5% |
| Food that needs jars and uses plastic bags | 0 | 100% | 0% |
| Food that needs jars, and does not need plastic bags | 106.36 | 82.8% | 17.2% |
| Food that needs jars, and is meat or poultry | 0 | 100% | 0% |
| Food that needs jars, and is not meat or poultry | 0 | 66.8% | 33.2% |
Table A5.
Figure A5 details—products that need plastic covers.
Table A5.
Figure A5 details—products that need plastic covers.
| Items | Score | 0 (Negative) | 1 (Positive) |
|---|---|---|---|
| Food that needs plastic covers | 868.88 | 56.1% | 43.9% |
| Food that needs plastic covers and trays | 0 | 0% | 100% |
| Food that needs plastic covers and does not need plastic trays | 0 | 94.3% | 5.7% |
Table A6.
Figure A6 details—products that need plastic trays.
Table A6.
Figure A6 details—products that need plastic trays.
| Items | Score | 0 (Negative) | 1 (Positive) |
|---|---|---|---|
| Food that needs plastic trays | 868.88 | 59.5% | 40.5% |
| Food that needs plastic covers and trays | 0 | 92.3% | 7.7% |
| Food that needs plastic trays and does not need plastic covers | 0 | 100% | 0% |
Table A7.
Figure A7 details—products that need plastic bags.
Table A7.
Figure A7 details—products that need plastic bags.
| Items | Score | 0 (Negative) | 1 (Positive) |
|---|---|---|---|
| Products that need plastic bags | 764.41 | 55.2% | 44.8% |
| Products that need plastic bags and plastic trays | 0 | 97.5% | 2.5% |
| Products that need plastic bags, and does not need plastic trays | 77.36 | 91.1% | 8.9% |
| Products that need plastic because of the quantity | 0 | 79.2% | 20.8% |
| Products that do not need plastic because of the quantity | 0 | 100% | 0% |
Appendix B. Random Forest Algorithm Results
Figure A8.
Organic food – Random Forest algorithm.

Figure A9.
Plant-based food—Random Forest algorithm.

Figure A10.
Canned food—Random Forest algorithm.

Figure A11.
Jarred food—Random Forest algorithm.

Figure A12.
Plastic bags—Random Forest algorithm.

Table A8.
Figure A8 details—organic food.
Table A8.
Figure A8 details—organic food.
| Product or Attribute | Likelihood | Explanation |
|---|---|---|
| Milk | 0.32 | Most of the organic food purchased is milk, and that quantity and level of freshness affect the purchases. |
| Quantity | 0.3 | |
| Level of freshness | 0.2 |
Table A9.
Figure A9 details—plant-based food.
Table A9.
Figure A9 details—plant-based food.
| Product or Attribute | Likelihood | Explanation |
|---|---|---|
| Organic | 0.61 | Most purchased plant-based products are also organic and milk products, and the level of freshness can also affect purchases. |
| Milk | 0.2 | |
| Level of freshness | 0.05 |
Table A10.
Figure A10 details—cans.
Table A10.
Figure A10 details—cans.
| Product or Attribute | Likelihood | Explanation |
|---|---|---|
| Meat or poultry | 0.55 | Most products that use cans are types of meat products; however, the level of freshness and quantity are drivers for purchasing such products. |
| Level of freshness | 0.25 | |
| Quantity | 0.02 |
Table A11.
Figure A11 details—jars.
Table A11.
Figure A11 details—jars.
| Product or Attribute | Likelihood | Explanation |
|---|---|---|
| Cheese | 0.72 | Among the products that use jars, cheese is the most purchased product, and that level of freshness and quantity are drivers of purchase decisions. |
| Level of freshness | 0.08 | |
| Quantity | 0.03 |
Table A12.
Figure A12 details—plastic bags.
Table A12.
Figure A12 details—plastic bags.
| Product or Attribute | Likelihood | Explanation |
|---|---|---|
| Plastic trays | 0.38 | Fruits and vegetables are the most common products that use plastic bags, covers, and trays. |
| Plastic cover | 0.23 | |
| Vegetables | 0.09 |
References
- The United Nations Environmental Program. Emission Gap Report 2022: The Closing Window. Available online: https://www.unep.org/resources/emissions-gap-report-2022 (accessed on 30 September 2023).
- Nunes, B.; Batista, L.; Masi, D.; Bennett, D. Sustainable Operations Management: Key Practices and Cases; Taylor & Francis Group: Abingdon, UK, 2022; Available online: https://ebookcentral.proquest.com/lib/uow/detail.action?docID=7133084 (accessed on 25 October 2023).
- Moore, S. How to Create a Business Case for Data Quality Improvement. Gartner, 2018. Available online: https://www.gartner.com/smarterwithgartner/how-to-create-a-business-case-for-data-quality-improvement (accessed on 20 February 2023).
- Johansson, L.; Jonasson, I.; Reim, W. Sustainable expansion: Capabilities for “New food source”—Companies. Futur. Foods 2023, 8, 100259. [Google Scholar] [CrossRef]
- Mo, A.; Zhang, Y.; Gao, W.; Jiang, J.; He, D. Environmental fate and impacts of biodegradable plastics in agricultural soil ecosystems. Appl. Soil Ecol. 2023, 181, 104667. [Google Scholar] [CrossRef]
- Hobrash, J. Determinants of environmental innovation—New evidence from German panel data sources. Res. Policy 2008, 37, 163–173. [Google Scholar] [CrossRef]
- Liang, H.; Cheah, S.M. Alibaba Cainiao’s Smart Green Logistics Strategy: Good for the Earth, Good for the Business; Harvard Business Publishing Education: Boston, MA, USA, 2021. [Google Scholar]
- Denne, L.; Sadler, G.; Common, D. Why Buying Plastic-Free Groceries Is so Hard (Marketplace). Youtube. Uploaded by CBC News, 12 January 2019. Available online: https://www.youtube.com/watch?v=n5Qbi_dB3Qo (accessed on 5 February 2023).
- Weidner, K.; Nakata, C.; Zhu, Z. Sustainable innovation and the triple bottom-line: A market-based capabilities and stakeholder perspective. J. Mark. Theory Pr. 2021, 29, 141–161. [Google Scholar] [CrossRef]
- Kostakis, P.; Kargas, A. Big-Data Management: A Driver for Digital Transformation? Information 2021, 12, 411. [Google Scholar] [CrossRef]
- Geyer, R.; Jambeck, J.R.; Law, K.L. Production, use, and the fate of all plastics ever made. Sci. Adv. 2017, 3, e1700782. [Google Scholar] [CrossRef]
- Gibbens, S. What You Need to Know about Plant-Based Plastics. National Geographic. 2018. Available online: https://www.nationalgeographic.com/environment/article/are-bioplastics-made-from-plants-better-for-environment-ocean-plastic (accessed on 20 February 2023).
- Germer, L.A.; van Middelaar, C.E.; Oosting, S.J.; Gerber, P.J. When and where are livestock climate-smart? A spatial-temporal framework for comparing the climate change and food security synergies and tradeoffs of Sub-Saharan African livestock systems. Agric. Syst. 2023, 210, 103717. [Google Scholar] [CrossRef]
- Seele, P. What Makes a Business Ethicist? A Reflection on the Transition from Applied Philosophy to Critical Thinking. J. Bus. Ethics 2018, 150, 647–656. [Google Scholar] [CrossRef]
- Barney, J.B.; Hansen, M.H. Trustworthiness as a Source of Competitive Advantage. Strat. Manag. J. 1994, 15, 175–190. [Google Scholar] [CrossRef]
- Orlitzky, M.; Schmidt, F.L.; Rynes, S.L. Corporate social and financial performance: A meta-analysis. Organ. Stud. 2003, 24, 403–441. [Google Scholar] [CrossRef]
- Michalos, A.C. The Business Case for Asserting the Business Case for Business Ethics. J. Bus. Ethics 2013, 114, 599–606. [Google Scholar] [CrossRef]
- Saurabh, K.; Arora, R.; Rani, N.; Mishra, D.; Ramkumar, M. AI led ethical digital transformation: Framework, research and managerial implications. J. Inf. Commun. Ethics Soc. 2022, 20, 229–256. [Google Scholar] [CrossRef]
- Duncan, A.D. Roadmap for Data Literacy and Data-Driven Business Transformation: A Gartner Trend Insight Report. Gartner, 2020. Available online: https://www.gartner.com/en/documents/3991368 (accessed on 2 February 2023).
- Davenport, T.H.; DalleMule, L. What Is Your Data Strategy. Harvard Business Review. The 2 Types of Data Strategies Every Company Needs (hbr.org). 2017. Available online: https://hbr.org/2017/05/whats-your-data-strategy (accessed on 20 February 2023).
- Young, A.; Rogers, P. A Review of Digital Transformation in Mining. Min. Met. Explor. 2019, 36, 683–699. [Google Scholar] [CrossRef]
- Ladley, J.; Redman, T.C. Use Data to Accelerate Your Business Strategy. Available online: https://hbr.org/2020/03/use-data-to-accelerate-your-business-strategy (accessed on 25 February 2023).
- Kayikci, Y.; Demir, S.; Mangla, S.K.; Subramanian, N.; Koc, B. Data-driven optimal dynamic pricing strategy for reducing perishable food waste at retailers. J. Clean. Prod. 2022, 344, 131068. [Google Scholar] [CrossRef]
- Buytendijk, F. Complete Your Data and Analytics Strategy with a Clear Value Proposition; Gartner: Stamford, CT, USA, 2020. [Google Scholar]
- Fleckenstein, M.; Fellows, L. Overview of Data Management Frameworks. In Modern Data Strategy; Springer: Cham, Switzerland, 2018. [Google Scholar] [CrossRef]
- Vendraminelli, L.; Macchion, L.; Nosella, A.; Vinelli, A. Design thinking: Strategy for digital transformation. J. Bus. Strat. 2023, 44, 200–210. [Google Scholar] [CrossRef]
- Dama International. DAMA-DMBOK: Data Management Body of Knowledge, 2nd ed.; Technics Publications, LLC: Denville, NJ, USA, 2017; p. 39. [Google Scholar]
- Munoz, J.M. (Ed.) Global Business Intelligence; Taylor & Francis Group: Abingdon, UK, 2017. [Google Scholar]
- IBM. What Is a Data Mart? 2020. Available online: https://www.ibm.com/topics/data-mart (accessed on 25 February 2023).
- Chang, E.; Rahayu, W.; Diallo, M.; Machizaud, M. Dynamic Data Mart for Business Intelligence. In Artificial Intelligence in Theory and Practice IV, IFIP AI 2015; IFIP Advances in Information and Communication Technology; Dillon, T., Ed.; Springer: Cham, Switzerland, 2015; Volume 465. [Google Scholar] [CrossRef]
- Oracle® Database. Introduction to Data Warehousing. In Data Warehousing Guide; Oracle: Austin, TX, USA, 2021; p. 36. [Google Scholar]
- Bouaziz, S.; Nabli, A.; Gargouri, F. From Traditional Data Warehouse to Real-Time Data Warehouse. In Intelligent Systems Design and Applications; ISDA 2016. Advances in Intelligent Systems and Computing; Madureira, A., Abraham, A., Gamboa, D., Novais, P., Eds.; Springer: Cham, Switzerland, 2017; Volume 557. [Google Scholar] [CrossRef]
- Amazon AWS. What Is a Data Lake? 2023. Available online: https://aws.amazon.com/big-data/datalakes-and-analytics/what-is-a-data-lake/ (accessed on 7 September 2023).
- Giebler, C.; Gröger, C.; Hoos, E.; Eichler, R.; Schwarz, H.; Mitschang, B. The Data Lake Architecture Framework: A Foundation for Building a Comprehensive Data Lake Architecture. In Proceedings of the Conference for Database Systems for Business, Technology and Web (BTW), Dresden, Germany, 6–10 March 2021. [Google Scholar] [CrossRef]
- Delta Lake 2.4.0. Delta Lake—Introduction. 2023. Available online: https://docs.delta.io/latest/delta-intro.html (accessed on 25 February 2023).
- Armbrust, M.; Ghodsi, A.; Xin, R.; Zaharia, M. Lakehouse: A New Generation of Open Platforms that Unify Data Warehousing and Advanced Analytics. Databricks, 2021. Available online: https://people.eecs.berkeley.edu/~matei/papers/2021/cidr_lakehouse.pdf (accessed on 12 November 2023).
- Armbrust, M.; Das, T.; Sun, L.; Yavuz, B.; Zhu, S.; Murthy, M.; Torres, J.; van Hovell, H.; Ionescu, A.; Łuszczak, A.; et al. Delta lake: High-performance ACID table storage over cloud object stores. Proc. Vldb Endow. 2020, 13, 3411–3424. [Google Scholar] [CrossRef]
- Littler, S. CHAID (Chi-Square Automatic Interaction Detector). 2017. Available online: https://select-statistics.co.uk/blog/chaid-chi-square-automatic-interaction-detector/ (accessed on 10 February 2023).
- Niladri Syam, R.K. Chapter 5, Random Forest, Bagging, and Boosting of Decision trees. In Machine Learning and Artificial Intelligence in Marketing and Sales: Essential Reference for Practitioners and Data Scientists; Emerald Publishing Limited: Leeds, UK, 2021; pp. 139–140. [Google Scholar]
- Guo, Y.; Wang, M.; Li, X. Application of an improved Apriori algorithm in a mobile e-commerce recommendation system. Ind. Manag. Data Syst. 2017, 117, 287–303. [Google Scholar] [CrossRef]
- Taylor, B.L.S.J. Prophet: Forecasting at Scale—Facebook Meta Research. 2017. Available online: https://research.facebook.com/blog/2017/02/prophet-forecasting-at-scale/ (accessed on 15 March 2023).
- Brownlee, J. A Gentle Introduction to XGBoost for Applied Machine Learning. 2016. Available online: https://machinelearningmastery.com/gentle-introduction-xgboost-applied-machine-learning/ (accessed on 10 February 2023).
- Kodama, M. Managing IT for Innovation: Dynamic Capabilities and Competitive Advantage; Taylor & Francis Group: Abingdon, UK, 2023; Available online: https://ebookcentral.proquest.com/lib/uow/detail.action?docID=6646924 (accessed on 12 February 2023).
- Kodama, M. Management System for Strategic Innovation: Building Dynamic Capabilities View of the Firm; Taylor & Francis Group: Abingdon, UK, 2023; Available online: https://ebookcentral.proquest.com/lib/uow/detail.action?docID=7263865 (accessed on 12 February 2023).
- Heider, A.; Gerken, M.; van Dinther, N.; Hülsbeck, M. Business model innovation through dynamic capabilities in small and medium enterprise—Evidence from the German Mittelstand. J. Bus. Res. 2021, 130, 635–645. [Google Scholar] [CrossRef]
- Cho, J.; Bian, Y.; Lee, J. Leading digital business model transformation in the K-pop industry: The case of SM Entertainment. Asia Pac. Bus. Rev. 2023, 1–31. Available online: https://www.tandfonline.com/doi/abs/10.1080/13602381.2023.2229761 (accessed on 30 October 2023). [CrossRef]
- Cho, J. Thriving in the global competitive landscape: Competitive dynamics and longevity of emerging market firms. Asian Bus. Manag. 2023, 1–28. [Google Scholar] [CrossRef]
- Cho, J.; Lee, J. How IDIS Survived after Internationalization? A Dynamic Capabilities Perspective. Korea Bus. Rev. 2018, 22, 79–98. [Google Scholar] [CrossRef]
- Zwingmann, T. Chapter 10, Demystifying BI with AI. Make Insights Actionable with AI and BI, At Scale, p. 86. Available online: https://www.atscale.com/resource/make-insights-actionable-with-ai-and-bi/ (accessed on 1 March 2023).
- Cho, J.; Garg, S.; Lee, J. Opening the Black Box: Boards of Directors, Competitive Aggressiveness, and Firm Performance. Acad. Manag. Proc. 2021, 2021, 12953. Available online: https://journals.aom.org/doi/abs/10.5465/AMBPP.2021.12953abstract (accessed on 30 October 2023). [CrossRef]
- Li, Z.; Liang, F.; Hu, H. Blockchain-Based and Value-Driven Enterprise Data Governance: A Collaborative Framework. Sustainability 2023, 15, 8578. [Google Scholar] [CrossRef]
- Wei, J.; Yi, X.; Yang, X.; Liu, Y. Blockchain-Based Design of a Government Incentive Mechanism for Manufacturing Supply Chain Data Governance. Sustainability 2023, 15, 6968. [Google Scholar] [CrossRef]
- Fan, Z.; Yan, Z.; Wen, S. Deep Learning and Artificial Intelligence in Sustainability: A Review of SDGs, Renewable Energy, and Environmental Health. Sustainability 2023, 15, 13493. [Google Scholar] [CrossRef]
Figure 1.
Aiken pyramid, modified after [27].
Figure 1.
Aiken pyramid, modified after [27].

Figure 2.
Dynamic data mart architecture [30].
Figure 2.
Dynamic data mart architecture [30].

Figure 3.
Data warehouse architecture [31].
Figure 3.
Data warehouse architecture [31].

Figure 4.
Data lake architecture framework [34].
Figure 4.
Data lake architecture framework [34].

Figure 5.
Data structure example—Python results (Anaconda Jupyter Notebook).

Figure 6.
Data structures of transaction records used to apply the Apriori algorithm.

Figure 7.
Libraries used in Python.

Figure 8.
Results using Python.

Figure 9.
Final support and confidence graph.

Figure 10.
Data structures of transactions.

Figure 11.
Holidays and trend charts.

Figure 12.
Yearly and weekly charts.

Figure 13.
Facebook Prophet MAPE result.

Figure 14.
Facebook Prophet + XGBoost MAPE result.

Figure 15.
XGBoost prediction results.

Figure 16.
Dashboard 1.

Figure 17.
Dashboard 2.

Disclaimer/Publisher’s Note: The statements, opinions and data contained in all publications are solely those of the individual author(s) and contributor(s) and not of MDPI and/or the editor(s). MDPI and/or the editor(s) disclaim responsibility for any injury to people or property resulting from any ideas, methods, instructions or products referred to in the content. |
© 2023 by the authors. Licensee MDPI, Basel, Switzerland. This article is an open access article distributed under the terms and conditions of the Creative Commons Attribution (CC BY) license (https://creativecommons.org/licenses/by/4.0/).
Share and Cite
MDPI and ACS Style
Dibsi, J.; Cho, J. Data Management for Environmentally Sustainable and Profitable Business: Evidence from the Food Retail Industry. Sustainability 2023, 15, 16298. https://doi.org/10.3390/su152316298
AMA Style
Dibsi J, Cho J. Data Management for Environmentally Sustainable and Profitable Business: Evidence from the Food Retail Industry. Sustainability. 2023; 15(23):16298. https://doi.org/10.3390/su152316298
Chicago/Turabian StyleDibsi, Joudi, and Jaeyoung Cho. 2023. "Data Management for Environmentally Sustainable and Profitable Business: Evidence from the Food Retail Industry" Sustainability 15, no. 23: 16298. https://doi.org/10.3390/su152316298
Note that from the first issue of 2016, this journal uses article numbers instead of page numbers. See further details here.